Barring an extraordinary final day, super funds are set to post a small negative return for the 2019/20 financial year – the first in 11 years. With one business day remaining, Chant West’s early estimate is that the median growth fund (61 to 80% in growth assets) will return -1.3%. While a negative result is never welcome, containing the loss to such a small number must be considered a good outcome considering the chaos the world has been thrown into by COVID-19.
Chant West senior investment research manager Mano Mohankumar says: “The 2019/20 year can be split into three parts. Over the first seven months to January, growth funds made steady progress and gained an impressive 6.4%. Then, in February and March, the seriousness of the COVID-19 pandemic and its likely impact on the global economy ravaged investment markets and growth funds fell a staggering 12%. Since late March, we’ve seen a surprisingly strong share market rally as investors have grown more optimistic. Coronavirus infection curves started to flatten around the world, governments began easing restrictions and economies tentatively started to reopen. All the while, massive liquidity was being pumped into the system by central banks. The rally continued into June, but more recently it has shown signs of wavering. This follows the US Federal Reserve’s grim outlook for the US economy, a surge in infection rates in North and South America especially and growing concern about a second wave worldwide. However, the June quarter is still positive overall, and we estimate that growth funds have returned 5.6%.
“Given all the medical and economic turmoil, funds have delivered a better result than many people would have expected. One key reason is that they maintain well-diversified portfolios invested across a wide range of growth and defensive asset sectors including, for many, a meaningful allocation to unlisted and alternative assets. That diversification works to cushion the impact during periods of share market weakness. At the same time, with a sizeable allocation of about 57% to listed shares and listed investments in infrastructure and property, funds are able to capture most of the upside when markets turn positive.
“This financial year’s result may be a disappointment to some members, but it’s important to remember that funds have had an unprecedented run for over 10 years, returning an impressive 8.2% per annum since the GFC low point in early 2009. That’s well ahead of the typical return objective which translates to about 5.5% per annum over the same period.
“While the median growth fund looks like returning about -1.3% for the year there will be some funds, as always, that will have done better with some even delivering positive returns. Others, of course, would have fared worse than the median. We expect the range of returns in our growth category to be between -6% and +3%.
“The majority of Australians are still invested in traditional growth funds, but the increase in the number of lifecycle strategies – where your investment risk varies according to your age – means that some people (generally those born in the 1970s or later) have higher allocations to growth assets (85% or more versus about 73% on average for the typical growth fund) and they would have fared worse than the growth fund median over the year. On the other hand, older members (those born in the 1950s or earlier) in lifecycle strategies would have much less invested in growth assets, so they can expect to have done better than the growth fund median, with small positive returns in some cases.”
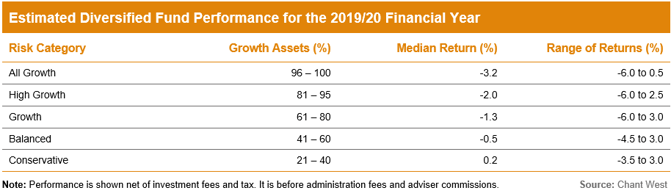
The table below shows the estimated median performance and ranges for each traditional diversified fund category in Chant West’s Multi-Manager Survey, ranging from All Growth to Conservative.
The chart below shows the median growth fund performance for each financial year since the start of compulsory super in July 1992. Over that 28 year period, the return has averaged 8% per annum. The annual CPI increase over the same period is 2.4%, giving a real return of 5.6% per annum – well above the typical 3.5% target. Even looking at the past 20 years, which now includes three share major market downturns – the ‘tech wreck’ in 2001–2003, the GFC in 2007–2009 and now COVID-19 – super funds have returned 6.4% per annum, which is ahead of the typical return objective.
If the current financial year finishes in negative territory as we expect, it would only be the fourth negative year in 28, an average of one every seven years. The typical risk objective for growth funds is no more than one negative year in five so, even if this year is in the red, funds will easily have achieved their risk objective as well as their return objective.

The drivers of performance in 2019/20
Mohankumar says: “The typical growth fund has on average 54% allocated to listed Australian and international shares, so the performance of those sectors has the greatest influence on overall returns. With only one day remaining, Australian shares are down 8.9% over the financial year. However, international shares are actually up 2.4% in hedged terms and the depreciation of the Australian dollar has pushed that up further to 4.5% in unhedged terms.
“Listed property has been the worst performing asset sector over the year, with Australian REITs and global REITs falling 20.3% and 17.7%, respectively. Global listed infrastructure was down 11.2%.
“Unlisted assets aren’t valued continuously, so it will be a little while before we can see exactly how they’ve performed. In our estimate we’ve assumed a flat return for unlisted property, unlisted infrastructure and private equity for the month of June. For the year, we expect returns from these asset sectors to generally range between 0% and -7%.
“In the traditional defensive asset sectors, bonds played their role as an important diversifier, with Australian bonds up 4.2% and global bonds gaining 5.2%. With interest rates at an all-time low, it’s not surprising that cash returned just 0.8%.”
International share market returns in this media release are sourced from MSCI. This data is the property of MSCI. No use or distribution without written consent. Data provided “as is” without any warranties. MSCI assumes no liability for or in connection with the data. Product is not sponsored, endorsed, sold or promoted by MSCI. Please see complete MSCI disclaimer.
