1 January 2019 marked the fifth anniversary of MySuper, the Government’s mechanism for directing default superannuation contributions into funds that offered ‘a simple, cost-effective, balanced product’ and met minimum standards. There were early fears that the focus on costs would result in a ‘race to the bottom’, with performance sacrificed in the competitive drive to reduce fees but largely this has not happened. What has been more pronounced is the use of lifecycle strategies which we expect will grow.
The introduction of MySuper proved to be a watershed in terms of superannuation product design, with clear differences emerging between the not-for-profit sector (mainly industry funds) and the for-profit retail sector.
Most not-for-profit funds decided that their existing products had been successful so they didn’t need to reinvent the wheel, and simply re-badged their default Growth options (61 to 80% growth assets) as their MySuper offerings.
By contrast, most of the retail sector took a different approach, opting to introduce entirely new products incorporating a lifecycle design, where members are allocated to an age-based option that is progressively de-risked as that cohort gets older. The rationale is that the younger cohorts, with many decades ahead before they retire, can afford to take on high levels of risk in the expectation of generating high returns in their early years of membership. As their cohort steadily ages, capital preservation becomes more important so the proportion of higher-risk growth assets (mainly shares) in the investment mix is reduced. The idea is to give these older members more protection in the event of a market downturn from which they may not have time to recover before they retire.
Chart 1 shows this de-risking in practice, setting out the median growth asset allocations of the various 10-year age cohorts (the light blue bars). For comparison, we also show the median allocation for our MySuper Growth category, which represents the majority of not-for-profit funds (the dark blue line). The MySuper Growth category is mainly comprised of single option MySupers but it also includes options with 61-80% growth assets that are building blocks within some not-for-profit fund lifecycle MySupers. In not-for-profit lifeycle MySupers, members are typically transferred between different options at certain ages.
Has The Performance Matched The Expectations?
Looking at the growth asset allocations, it is clear that younger members in retail funds take on considerably more market risk than the ‘one size fits all’ MySuper Growth, while older members take on less risk. How has that worked out for them over the first five years of MySuper? And what about 2018, when major share markets fell sharply over the last quarter and went backwards over the full year?

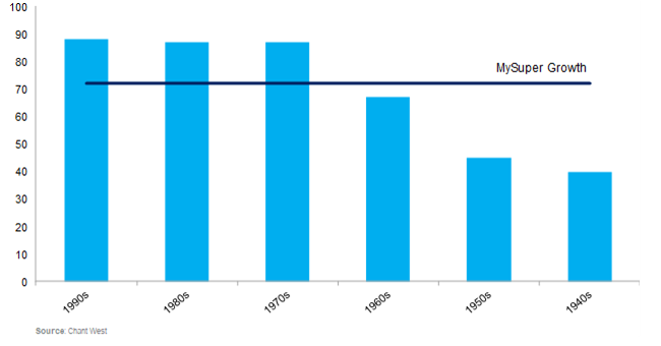
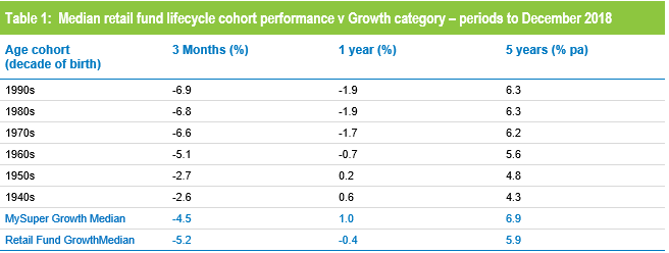
Table 1 shows performance over three months, one year and five years to 31 December 2018. Looking first at the December quarter of 2018, when share markets retreated sharply, it shows that older members of retail funds did indeed receive some protection, in that their losses were smaller than those of younger members and of the MySuper Growth median.
Over the full calendar year, however, while the older 1940s and 1950s cohorts recorded marginal gains as against losses for those born in the 1960s or later, they still underperformed the MySuper Growth median. In other words, in a year when the most important growth assets – Australian and international shares – recorded losses, even the retail lifecycle members with the lowest exposure to those sectors would have been better off in a traditional Growth option, as offered by most not-for-profit funds.
A similar picture emerges over the full five year history of MySuper, except that growth asset performance was stronger over this longer period so younger members of retail lifecycle funds did better than older ones. However, none of the retail cohorts managed to match the performance of the MySuper Growth median.
What conclusion can we draw from this analysis? The early results from retail lifecycle products has been mixed.
Looked at in isolation, these products are performing as expected. When shares are rising the younger members with higher allocations to those assets do better. When share markets fall back, older members do get some protection but, over time, that protection comes at a cost because they miss out on the full benefits when markets rise.
It is also worth noting that each age cohort has met its return objective over five years. Also, performance for younger members (those born in the 1970s or later), has been ahead of the retail fund growth median which is probably what retail members would have experienced if a lifecycle strategy had not been introduced.
However, the overall performance of these retail lifecycle products relative to the MySuper growth options of not-for-profit funds has been disappointing.
Unlisted Assets Have Made The Difference
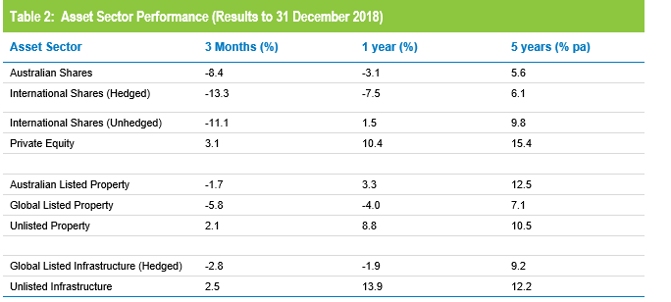
When we look at the factors that contribute to fund performance, we find that the main reason retail funds have lagged – even at the younger ages where growth allocations are higher – is that they have been less diversified than their not-for-profit counterparts and, in particular, have had less invested in unlisted assets (unlisted property and infrastructure and private equity) and more in listed shares and property and bonds.
The significance of those allocation differences become clear when we look at Table 2 which shows the performance of these asset sectors – again over three months, one year and five years to 31 December 2018. Almost without exception over all those time periods, unlisted assets have produced higher returns than their listed equivalents.
It is true that retail funds are somewhat constrained in how they invest by their greater need for liquidity, because their cash flows aren’t as strong as those of the not-for-profit funds. It is also true that, since retail MySuper funds started gaining sufficient scale following the transition of accrued default amounts in 2016/17, a few have been increasing their target allocations to unlisted assets in an attempt to better compete with not-for-profit funds. However those allocations, both current and targeted, are still far lower than those of most not-for-profit funds.
Active Management Has Proved Its Worth
When MySuper was first proposed, one of our concerns was that the emphasis on low fees might cause good funds to change the way they invested. We were worried that there would be a move towards low-cost, indexed management of all asset classes at the expense of active management and that this would be to the detriment of net, post-fee performance. Initially, there was indeed an increase in passive or enhanced passive management in some instances but it has been less prevalent than we feared and few others have followed this approach.
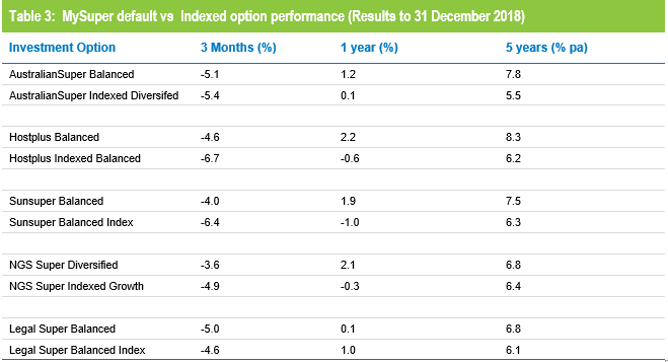
To illustrate the worth of active management within the context of a diversified fund, we can look at the performance of the five funds in our universe that offer an indexed option with about 70% growth assets as well as a traditional diversified MySuper Growth option.
Table 3 compares the performance of each fund’s indexed and MySuper default. Except for Legal Super, the traditionally-managed MySuper default has outperformed the indexed option over the negative December 2018 quarter, the marginally positive 2018 calendar year and over the full 5 year lifetime of MySuper. The main reason for the outperformance is industry funds’ exposure to unlisted assets in their MySuper options that are not available in indexed strategies which are limited to assets with listed market benchmarks. Some not-for-profit funds have also benefited from the strong performance of their active managers, especially in Australian shares
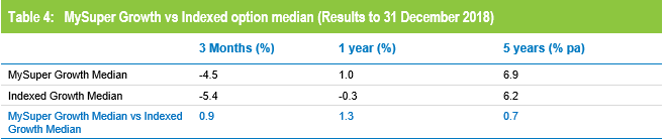
In Table 4, we also compare the median of those five indexed options with the overall MySuper Growth median. The result, again, is that the traditional approach, largely based on active management, comes out on top.
Despite some recent commentary that industry funds are more aggressive than they disclose, there is a valid argument for treating some of their unlisted assets as partly defensive. Therefore, we believe the above tables are fair comparisons as they consider options with similar risk profiles
Super Can Be Improved, But It’s Far From Broken
Australia’s superannuation system is under intensescrutiny at present, what with the malpractices exposed by the Financial Services Royal Commission and the system overhaul proposed by the Productivity Commission. To the casual observer it might seem that
the system is irretrievably broken, but we would argue otherwise.
Our combination of compulsory work-related contributions, tax concessions for contributions and investment returns and a means-tested Age Pension is widely regarded as one of the best in the world. While there are some laggards, the majority of funds have delivered on the investment expectations they set out for their members, both in terms of risk and return, and have done so over very long periods.
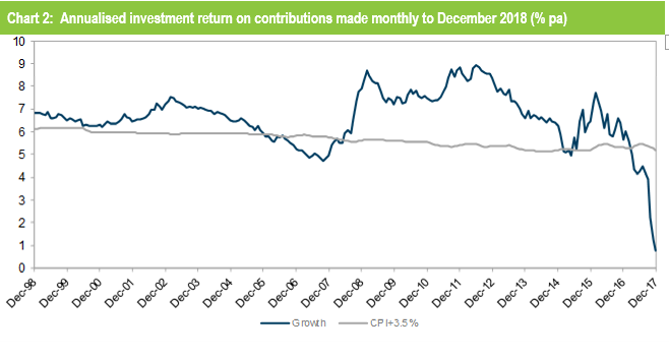
To reflect how super funds have performed over the longer term and to remove any starting point dependency, in Chart 2 we show the annualised return on a contribution made to the median Growth fund at the end of each month over the past 20 years, from the date of each contribution to December 2018. That return is plotted against the typical long-term objective of CPI + 3.5% per annum. The good news is that the return on a contribution made at almost any time over the last twenty years has exceeded the long-term objective, often by a substantial margin. The only exceptions are for money contributed in the couple of years leading up to the global financial crisis (GFC), where the return is only just under the objective, and in 2018 when the annual was just 0.8%. This general outperformance of the objective is despite the fact that much of the period reflected in the chart is affected by losses of about 26% for growth funds during the GFC.
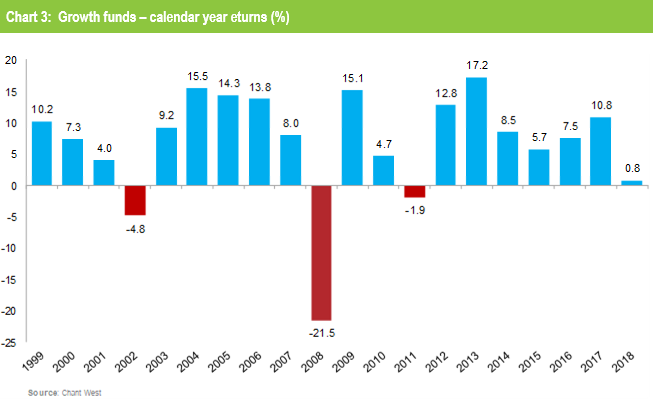
That is the return part of the equation. As for risk, the typical expectation would be no more than one negative return in five years on average. Over the past 20 years that would mean no more than four negative years. Chart 3 shows that there have only been three, so the risk objective has also been met.
So Australians have, in general, been very well served by their superannuation funds over the five years since MySuper was introduced. That is not to say that the system cannot be improved, and we would point to the following as the important changes that are either under way or on the urgent ‘To Do’ list:
- Reduce the number of wasteful and inefficient multiple accounts by keeping job changers in their previous fund unless they choose to change and consolidating more small and inactive accounts.
- Prune back the number of default funds by removing the sub-scale, chronic underperformers. Rather than applying an artificial ‘best in show’, the adoption of APRA’s proposed ‘elevated outcomes’ test could be used as a benchmark that must be met to continue to offer a MySuper product. This will ensure we keep funds that meet an acceptable standard rather than applying an artificial maximum through a limited number of preferred products that would inevitably lack the diversity and specialisation we have in the market now.
- Continue to improve the transparency of fees and costs by implementing the revised RG 97 measures. While RG 97 does not change the fees that members actually incur, it should allow for more informed comparisons of one fund with another.
