After losing 12% over February and March as investors reacted to the potential economic impact of COVID-19, super funds had some respite in April. The median growth fund (61 to 80% in growth assets) bounced back 3.1% on the back of rallying share markets. However, this still leaves the return for the ten months of the financial year to date in the red at -3.3%.
Chant West senior investment research manager Mano Mohankumar says: "April saw share markets rebound as investors grew more optimistic around coronavirus curves flattening around the world, the expectations of lockdowns easing and economies starting to reopen, partially at least. While this provided some relief after the pounding markets took in the previous two months, it's still far too early to tell what the full impact of COVID-19 will be on individual companies, industries and the global economy. While some countries are easing restrictions to varying degrees, the dire situation unfolding in the US remain a serious concern.
"We are heading towards a global recession, but we don’t know what the shape of that recession and the eventual recovery will be. However, we do know that markets bounce back faster than economies. Regardless of the pace of any recovery, we should expect heightened volatility to continue as investors react sharply to news – good or bad. During this challenging period, fund members both young and old need to remember that superannuation is for the long term and the best strategy is almost always to remain patient and ride out the volatility. If anyone is thinking about switching to a less risky option, we strongly encourage them to seek financial advice before doing so.
"Unfortunately, super funds have already seen some members hurt themselves by locking in losses in March by switching to a more conservative option perhaps with the intention of switching back later as markets rallied. This is the very thing we caution against. Trying to time markets is a risky proposition at any time. If you take panic action after share markets have already fallen you only convert paper losses into real ones. Not only that, you also risk missing out when markets rebound as they will at some point. Being out of the market during share market volatility, even for a few key days, can make a significant difference to your returns."
Australian shares returned 9% in April. International shares were up 10.6% in hedged terms but the appreciation of the Australian dollar over the month (from US$0.61 to US$0.65) reduced that gain in unhedged terms to 3.6%. On average, funds currently have about 70% of their international shares exposure unhedged. That foreign currency exposure typically provides a natural hedge against share market falls, as we saw in February and March.
Table 1 compares the median performance for each of the traditional diversified risk categories in Chant West's Multi-Manager Survey, ranging from All Growth to Conservative. Naturally, the large losses over February and March have had a dampening effect, particularly on the shorter-term numbers. However, despite these recent losses, all risk categories have met their typical return objectives over 7 and 10 years. Over 15 years, only the highest risk All Growth category fell a fraction short of its objective. But we need to remember that the 15-year return also includes the full GFC period during which the All Growth category was the worst affected, losing 40%.
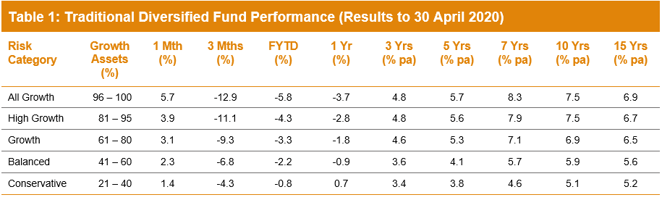
Note: Performance is shown net of investment fees and tax. It is before administration fees and adviser commissions.
Source: Chant West
Lifecycle products behaving as expected
Mohankumar says, "While our Growth category is still where most people have their super invested, a meaningful number are now in so-called 'lifecycle' products. Most retail funds have adopted a lifecycle design for their MySuper defaults, where members are allocated to an age-based option that is progressively de-risked as that cohort gets older."
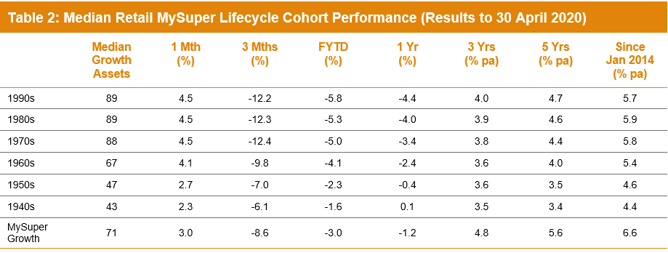
It's difficult to make direct comparisons of the performance of these age-based options with the traditional options that are based on a single risk category, and for that reason we report them separately. Table 2 shows the median performance for each of the retail age cohorts, together with their current median allocation to growth assets. It also includes a row for traditional MySuper Growth options for comparison – nearly all of which are not-for-profit funds. Care should be taken when comparing the performance of the retail lifecycle cohorts with the median MySuper Growth option, however, as they are managed differently so their level of risk varies over time.
Notes:
1. Performance is shown net of investment fees and tax. It is before administration fees and adviser commissions.
2. January 2014 represents the introduction of MySuper.
Source: Chant West
Despite a positive April, the setback in February and March has resulted in those options that have higher allocations to growth assets faring worse over all periods up to one year. Over longer periods those higher-risk options, which cover the younger cohorts born in the 1960s or later, have performed better, although not as well as the median MySuper Growth option.
The reason these younger cohorts in retail lifecycle funds have underperformed the MySuper Growth option is that, while they are generally well-diversified, these funds don’t have the same level of diversification as many of the not-for-profit funds. This is mainly due to the not-for-profit funds' higher allocations to unlisted assets (unlisted property, unlisted infrastructure and private equity) – about 21% on average. This compares with the retail lifecycle fund average of 5% for these younger cohorts, although there are a few that have 10-14% unlisted asset allocations. These assets have been proven to add value over the long term, not just for their diversification qualities but also because they generate an illiquidity premium in their returns relative to listed markets. However, any performance comparison at the end of April is further complicated by the fact that some funds have devalued their unlisted assets more aggressively than others.
The older cohorts (those born in the 1950s or earlier) are relatively less exposed to growth-orientated assets so you would expect them to underperform the MySuper Growth median over longer periods. Capital preservation is more important at those ages so, while they miss out on the full benefit in rising markets, older members in retail lifecycle options are better protected in the event of a market downturn such as we saw over February and March.
Long-term performance remains above target
MySuper products have only been operating for just over six years, so when considering performance it is important to remember that super is a much longer-term proposition. Since the introduction of compulsory super in 1992, the median growth fund has returned 7.9% per annum. The annual CPI increase over the same period is 2.4%, giving a real return of 5.5% per annum – well above the typical 3.5% target. Even looking at the past 20 years, super funds have returned 6.3% per annum, which is ahead of the typical return objective. Let's not forget that the 20-year period now includes three share major market downturns – the 'tech wreck' in 2001–2003, the GFC in 2007–2009 and now COVID-19.
With the median growth fund return sitting at -3.3% for the first 10 months it seems probable, but not certain, that the current financial year will produce a negative return. If so, that would be the fourth negative year in 28, an average of one every seven years. The typical risk objective for growth funds is no more than one negative year in five, so even if this year is negative it will still be well within the expected risk parameters.
For most of the compulsory super era, funds typically set their return objectives over rolling five-year periods. However, over recent years we've seen more and more funds move to re-set their objectives over rolling ten-year periods, which is more consistent with a longer-term focus. We believe it is appropriate for us now to use rolling ten-year performance data when we plot the performance of the median fund versus the typical return objective. The chart below shows that, for the majority of the time, the median growth fund has exceeded its return objective. The exceptions are two periods between mid-2008 and mid-2017, when it fell behind. This is because of the devastating impact of the 16-month GFC period (end-October 2007 to end-February 2009) during which growth funds lost about 26% on average. That impact persists far longer in a rolling 10-year chart than it does in our previous rolling 5-year chart.
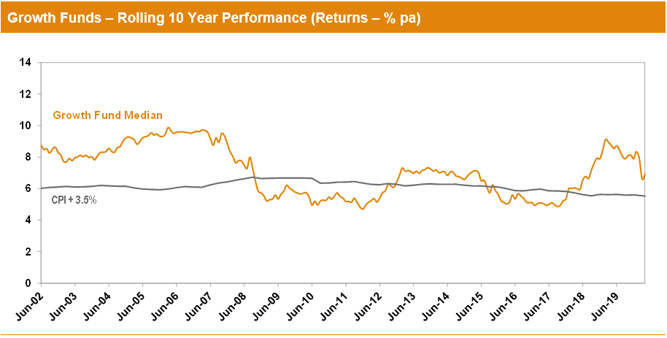
Note: The CPI figure for April 2020 is an estimate.
International share market returns in this media release are sourced from MSCI. This data is the property of MSCI. No use or distribution without written consent. Data provided “as is” without any warranties. MSCI assumes no liability for or in connection with the data. Product is not sponsored, endorsed, sold or promoted by MSCI. Please see complete MSCI disclaimer.
