Super fund returns were up for the fourth consecutive month in April, with the median growth fund (61 to 80% in growth assets) riding the ongoing rally in share markets for a gain of 1.7%. Coming on the back of the 6.1% return for the March quarter, the return over the first 10 months of the financial year is now firmly in positive territory at 5.2%.
Australian shares gained 2.5% in April, while international shares were even stronger with a rise of 3.8% in hedged terms. The slight depreciation of the Australian dollar over the month (down from US$0.71 to US$0.70) boosted that even further to 4.6%. Listed property’s recent strong run came to an end, however, with Australian and international REITs retreating 2.3% and 1.1%, respectively.
Chant West senior investment research manager Mano Mohankumar says: “With the cumulative return over the first 10 months of the 2019 financial year sitting at 5.2%, it’s increasing likely that growth funds will finish the year in the black for the tenth consecutive time. The return isn’t likely to match the 9% average return of the past nine years, but that strong run should be seen as the exception rather than the rule. With inflation running at about 1.5%, a return of about 5% would be broadly in line with the long-term return objective which is to beat inflation by 3.5%.
“The strong share market performance in April was on the back of encouraging economic data and ongoing dovishness from major central banks around the world which supported an appetite for riskier assets.
“While the results over the past four months have been positive, we caution members not to get carried away. In the past week we’ve seen the re-emergence of trade tensions between the US and China, prompting a retreat in global share markets so far in May. And while concerns about Brexit and the pace of global economic growth may have lessened, they are still lingering at the back of investors’ minds.”
Table 1 compares the median performance for each of the traditional diversified risk categories in Chant West’s Multi-Manager Survey, ranging from All Growth to Conservative. All risk categories are now ahead of their long-term return objectives over 1, 3, 5, 7, 10 and 15 years.
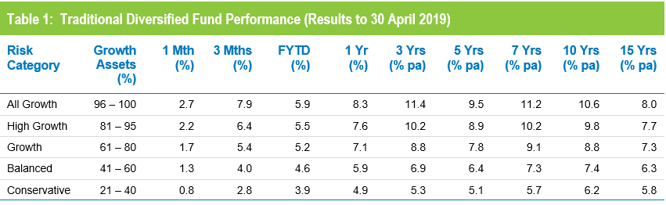
Source: Chant West
Note: Performance is shown net of investment fees and tax. It is before administration fees and adviser commissions.
Lifecycle products behaving as expected
Mohankumar says, “While our Growth category is still where most people have their super, a meaningful number are now in so-called ‘lifecycle’ products. Most retail funds have adopted a lifecycle design for their MySuper defaults, where members are allocated to an age-based option that is progressively de-risked as that cohort gets older.
“It’s difficult to make direct comparisons of the performance of these age-based options with the traditional options that are based on a single risk category, and for that reason we report them separately. Table 2 shows the median performance for each of the retail age cohorts, together with their current median allocation to growth assets.”
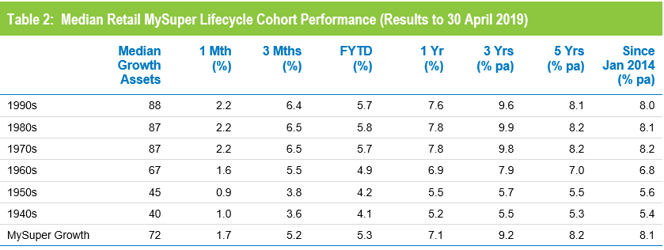
Source: Chant West
Note: Performance is shown net of investment fees and tax. It is before administration fees and adviser commissions.
While lifecycle is the most common MySuper default in the retail sector, most not-for-profit funds still use their traditional growth options for that default role. A few have gone down the lifecycle path, however, and while the general premise is the same the way it is implemented is different. Rather than allocating members to age-based cohorts as retail funds do, in the not-for-profit lifecycle model members typically ‘switch’ from one traditional risk category to another at particular ages. The diversified options that underlie these strategies are included in Table 1.
To help illustrate the early results of the retail lifecycle model, Table 2 includes a row for traditional MySuper Growth options – mainly, but not all, not-for-profit funds. Care should be taken when comparing the performance of the retail lifecycle cohorts with the median MySuper Growth option, however, as they are managed differently so their level of risk varies over time.
Aside from the 2018 calendar year, we have seen strong performance from growth assets in recent years so, as you would expect, the options that have higher allocations to growth assets have generally done best. Younger members of retail lifecycle products – those born in the 1970s, 1980s and 1990s – have held their own compared with the median MySuper Growth fund, although they have been ahead in more recent times. However, they have done so by taking on more share market risk.
The older age cohorts (those born in the 1960s or earlier) are less exposed to share market risk. Capital preservation is more important at those ages so, while they miss out on the full benefit in rising markets, older members in retail lifecycle options should be better protected in the event of a market downturn. Indeed, we saw that theory work well in practice over the December 2018 quarter.
Long-term performance remains above target
MySuper products have been operating for less than five years, so when considering performance it is important to remember that super is a much longer-term proposition. The Chart below compares the performance since July 1992 – the start of compulsory superannuation – of the traditional Growth category median with the typical return objective for that category (CPI plus 3.5% per annum after investment fees and tax over rolling five-year periods). Notwithstanding the sharp downturn at the end of 2018, the healthy returns since early 2009 have seen the longer-term performance tracking well above that CPI plus 3.5% target for the past five years.
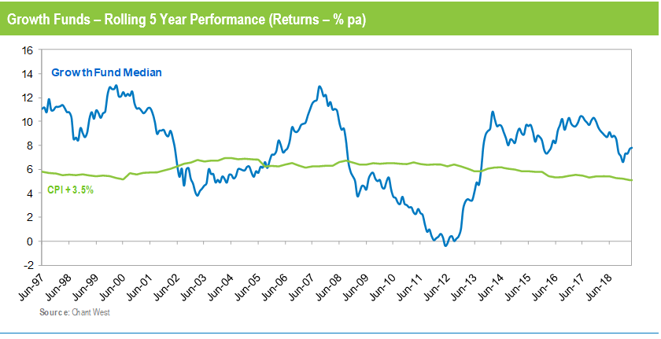
Note: The CPI figure for April is an estimate.
