October’s share market falls mean that super funds are heading towards a more modest calendar year result than in recent years. The median growth fund (61 to 80% in growth assets) slipped 3% in October, pulling back the return for the first ten months of 2018 to 2.4%. Midway through November that figure has reduced further to an estimated 1.8%. But according to Chant West, this is not a bad result considering the recent falls in markets.
In October, domestic and global share markets experienced sharp losses. Australian shares fell 6.2%. International shares retreated 6.8% in hedged terms but the depreciation of the Australian dollar (down from US$0.72 to US$0.71) limited the loss in unhedged terms to -5.4%. Listed property also slipped, with Australian and international REITs losing 3.1% and 3.2%, respectively.
Chant West senior investment research manager Mano Mohankumar says: “Despite a disappointing October, growth funds still have a good chance of finishing in positive territory for the seventh consecutive calendar year. However, this year’s return is certain to be well below the 10% average of the previous six years. But members need to remember that an average of 10% is not normal. Growth funds are typically constructed to beat inflation by 3.5%, which translates to about 6% per annum over the long term.
“A more modest return this year doesn’t come as a surprise. Asset managers have been saying for some time that, given the exceptional run investment markets have had since the end of the GFC, most asset sectors are now priced at the top of their valuations, or close to it.
“The month of October was a great example of the benefits of diversification, and a reminder that growth fund performance isn’t driven entirely by listed shares and property. On average, growth funds have about 55% invested in those markets, which leaves a substantial 45% allocated across a wide range of other sectors, including unlisted infrastructure and property as well as traditional defensive sectors like bonds and cash. This helps cushion the blow when there are sharp market falls. So, while Australian shares and hedged international shares were down 6.2% and 6.8%, respectively, the median growth fund was down less than half that at 3%.
“Older members approaching retirement naturally have a lower tolerance for seeing their balances go down than younger members. However, they also tend to be more conservatively invested. Conservative funds (21 to 40% in growth assets) were only down 1% in October.
“We encourage members to treat their superannuation as a long-term investment. They should check that the investment option they’re in is suitable for them and, if so, remain patient and not get distracted by short-term noise. Trying to time the market by moving into a more conservative option after sharp share market falls can be detrimental because not only do you crystallise your losses, but you also risk missing out on all or part of the subsequent rebound when markets recover.”
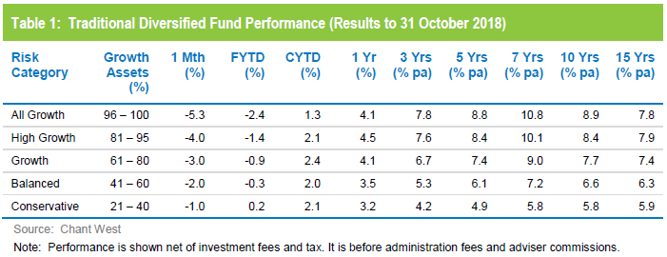
Table 1 compares the median performance for each of the traditional diversified risk categories in Chant West’s Multi-Manager Survey, ranging from All Growth to Conservative.
Most retail fund default members now in lifecycle products
Mohankumar says, “While our Growth category is still where most people have their super, a meaningful number are now in so-called ‘lifecycle’ products. Most retail funds have adopted a lifecycle design for their MySuper defaults, where members are allocated to an age-based option that is progressively de-risked as that cohort gets older.
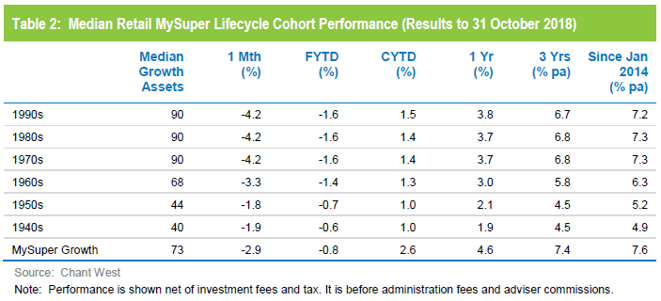
“It’s difficult to make direct comparisons of the performance of these age-based options with the traditional options that are based on a single risk category, and for that reason we report them separately. Table 2 shows the median performance for each of the retail age cohorts, together with their current median allocation to growth assets.”
While lifecycle is the most common MySuper default in the retail sector, most not-for-profit funds still use their traditional Growth options for that default role although a few have also gone down the lifecycle path. While the general premise is the same, in the not-for-profit lifecycle model members ‘switch’ from one traditional risk category to another at particular ages. The diversified options that underlie these products are included in Table 1.
To illustrate the early results of the lifecycle model, Table 2 includes a row for these traditional MySuper Growth options – mainly, but not all, not-for-profit funds. Caution should be taken when comparing the performance of the retail lifecycle cohorts with the median MySuper Growth option as they are managed differently so the level of risk varies over time.
The past few years have seen strong performance from growth assets so, as you would expect, the options that have higher allocations to growth assets have done best. Up until last month, younger members of retail lifecycle products – those born in the 1970s, 1980s and 1990s – had held their own compared with the median MySuper Growth fund, but had done so by taking on more share market risk. However, as a result of the share market falls in October, their performance now lags the MySuper Growth median over all periods shown in Table 2.
Since the introduction of MySuper, older members – those born in the 1960s or earlier – have underperformed traditional MySuper Growth options by some margin because these older cohorts have taken on less risk. This is because capital preservation becomes more important at those ages so, while they miss out on the full benefit of rising markets, older members in retail lifecycle options are better protected in the event of a market downturn. October has been a great example of this, with the short-term results in Table 2 showing that the older cohorts have borne less of the downturn than the younger ones and less than the median MySuper Growth fund.
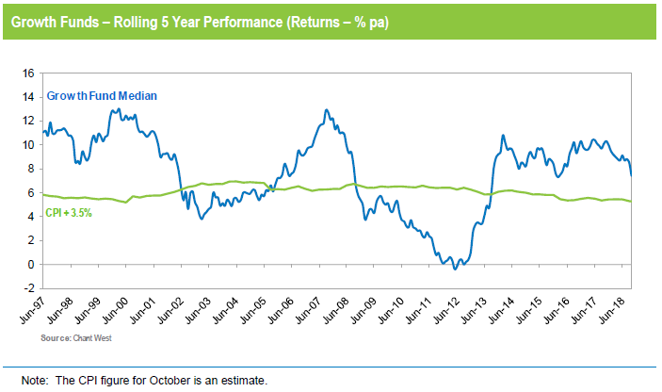
Long-term performance remains above target
MySuper products have been operating for less than five years, so when considering performance it is important to remember that super is a much longer-term proposition. The Chart below compares the performance since July 1992 – the start of compulsory superannuation – of the traditional Growth category median with the typical return objective for that category (CPI plus 3.5% per annum after investment fees and tax over rolling five-year periods). The healthy returns in recent years have seen the five year performance tracking well above that CPI plus 3.5% target for the past five years.