The ultimate purpose of superannuation is to provide an income in retirement, but often that fundamental point is lost. That's hardly surprising, considering that most of the public discussion focuses exclusively on lump sums. To the average member, some of the numbers bandied about sound more like Lotto prizes than real life targets, so no wonder they switch off and fail to engage. One way to change the focus is through online calculators that generate income projections. These are becoming more common, but to be really useful they need to be more comprehensive and more consistent in their design, assumptions and outcomes.
The media loves talking in big numbers, and sadly the superannuation industry is only too happy to oblige. We forget that the real world is not populated by actuaries. Witness the recent debate about whether $1 million at age 65 is "enough". To the average fund member, that sort of number is so far removed from reality that they pay no attention, which is a shame because the underlying debate about contribution levels, asset allocations, retirement ages etc is important.
At the member communication level, too, the industry has tended to speak in a foreign language. Until quite recently, for example, almost all member statements have referred to benefits exclusively as lump sums, despite those figures having no context and therefore no relevance to the member's everyday life.
It means very little, for example, to a 40 year old to be told that they have $150,000 in their account. Is that a lot? Too little? About right? It only starts to become real when they're also told on their statement that they're on track for a retirement income from age 65 of $30,700 per annum – that's in today's dollars and includes the Age Pension. Now they have something they can relate to and, if they feel it's not going to be enough, it might just spur them to take some action such as contributing more or changing their investment option.
While one on one advice might be the ideal way of conveying these messages, we know that only a small proportion of members will avail themselves of it. So funds need to find another way, and that's where online calculators come into play. Developing these calculators is one of the fastest growing areas of member services and it's one where funds can create a point of difference by doing it better.
First, how about some consistency?
Before we consider what the ideal calculator might look like, we should give some thought to the basic issue of consistency. Our industry is notorious for inconsistencies between funds in product design and disclosure, most notably in the areas of fees and insurance. Sadly, that same trait is evident when it comes to online calculators.
The degree of inconsistency – and the divergent results it produces – is quite remarkable. Chart 1, shows the benefit projections for a simple case study using the online calculators of seven of the largest public offer funds in Australia (representing over 8 million members), together with ASIC’s superannuation calculator on its MoneySmart consumer website. MoneySmart gives the lowest projected lump sum while other funds range from $242,081 (Fund G) to $376,809 (Fund B) – that’s about 55% more. How can this be?
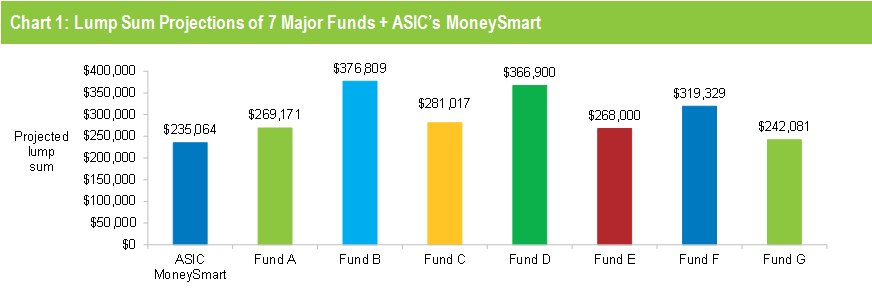
Source: Chant West
Based on: Male aged 35; salary $60,000; account balance $50,000; SG contributions only; default assumptions; no career breaks; retirement age 65.
Note: ASIC’s projected lump sum is based on a revised calculator that will be released shortly.
The answer, of course, is to do with the assumptions behind each calculator. These vary enormously and, because even small differences have a big impact over long periods, they are responsible for the wildly differing outcomes.
The most obvious – and the most influential in terms of the results they produce – are to do with investment returns. These and other key assumptions are set out in Table 1 which shows, for example,
- The assumed annual return for the default growth option ranges from 5.75% (Fund G) to 6.5% (Funds B and F). Our analysis did include another major fund (Fund H) that is not shown in the illustrations because it doesn't project lump sums, but it's return assumption is higher still at 7.0%
- Some funds assume returns before fees and tax, while others are net of fees and tax, and others still are a mixture. Note that the highest assumed returns in the table (6.5% for Funds B and F) are both after fees and tax
- The assumed tax rate on fund earnings ranges from 9% (Fund C) to 15%, with the majority of funds making no allowance for the deductions and offsets they receive. Note that the MoneySmart calculator assumes an effective tax rate of 7%
- The net investment return ranges from 4.51% (Fund A) to 6.5% (Funds B and F)
- The discount factors used to convert future dollars into today's dollars range from 3% (Fund D) to 4.45% (Fund G)
- As a result of all the above, the net real return ranges from 0.44% (Fund G) to 3.05% (Fund D)
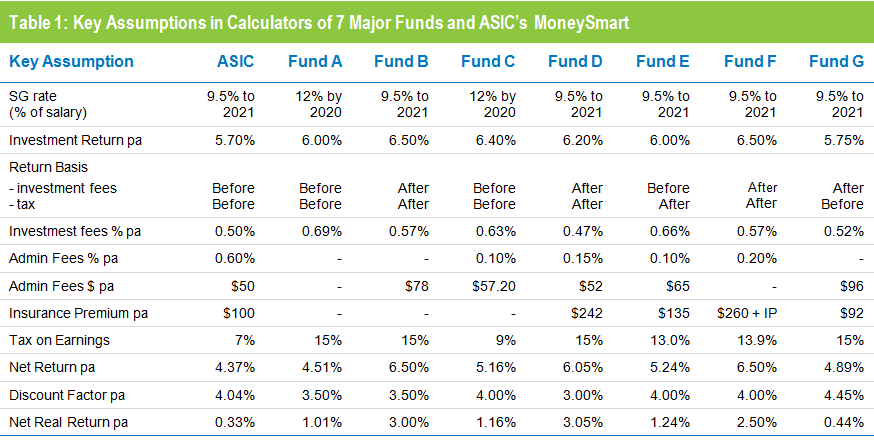
Source: Chant West
Notes:
1. ASIC’s calculator assumptions are based on a revised calculator that will be released shortly
2. Net Return is after tax, investment fees and any %-based administration fees
3. The Return Basis for Fund F is after both administration and investment fees
For our analysis we accepted the key default assumptions for each fund. Most calculators allow the member to change these but few do. Also, we have looked at the asset allocations of each fund to see if these might justify different return assumptions. What we found was that the asset allocations of the funds with the highest projected benefits are quite similar to those projecting the lowest benefits.
We have focused on lump sum benefits, rather than retirement incomes, only because funds show income projections in quite different ways. For example, some show income for a fixed period (which varies between funds) while others show how long a certain level of income will last. Likewise, some include the Age Pension but others don' t.
To the extent that we can, we have tried to compare income projections on a consistent basis, and again we find that there is a huge range of outcomes for exactly the same inputs. In fact, the differences are even larger, if anything.
Of those that include the Age Pension, projected income for 25 years from age 65 (for a homeowner) varies between about $30,000 p.a. and $38,000 p.a. However Fund H, which as mentioned earlier only projects incomes and assumes a 7.0% return net of fees and tax, produces a figure of $43,000 p.a.
What should be done?
While it is reasonable for funds to use their own fees and insurance premiums in their calculators, default investment returns and discount rates should be standardised as much as possible. These assumptions are, after all, forward looking and therefore unknown, and they do have the greatest influence on outcomes.
If funds wish to use non-standard assumptions, based on the argument that their default options are likely to produce different long term returns for some reason, then they should be required to justify that and obtain a technical sign off, either from ASIC or from a professional such as an actuary. This would ensure that assumptions will only be different when there is a good reason for it.
It is not as if standardisation is a new concept. When it comes to benefit forecasts in member statements, ASIC is very clear about what is permissible. Most importantly, it specifies (in Regulatory Guide 229) that the earnings assumption should be an annual real rate of return (i.e. relative to wage growth), net of tax and investment fees, of 3%.
As we have seen, the earnings rate assumptions in calculators are many and varied. It is likely that a member could look at the forecast benefit in his member statement, enter the same basic information into his fund's online calculator and come up with a completely different end result. Similarly, two individuals with the same parameters but in different funds could compare results and find substantial differences for no apparent reason.
Clearly, there is potential for confusion and perhaps even mistrust and that is most likely to lead to inaction – exactly the opposite of what the calculator is intended for.
While we've argued that more standardisation is desirable, that doesn't mean all calculators should be the same. There is still plenty of scope for the better funds to distinguish themselves by building calculators that are more user friendly, more engaging and more realistic than those of their competitors.
What is the ideal in an online calculator?
We would argue that an online calculator should inform and educate the member using it, and point them towards actions they can take to improve their situation.
It should be customisable, so that it reflects their personal circumstances as closely as possible, and it should acknowledge that there are other factors outside the fund in question that will have a bearing on their financial future. It should be up to date. Of the seven funds in our table, for example, at least three have not been updated to account for the deferred Superannuation Guarantee increases.
It should focus on their projected retirement income, and only show the lump sum value as a secondary matter. It should refer to the ASFA retirement standards, both modest and comfortable, for comparison purposes and include 'call to action' links to show ways the member can influence their future.
As well as being clear, up to date and easy to use, a best practice calculator will:
- Include assets outside super
- Include the member's partner
- Include a retirement income budget tool to help in target setting
- Include the anticipated Age Pension, with a graphic that shows how their total income may be sourced
- Show life expectancies, with indications of how likely they are to live beyond certain ages
- Allow for work breaks
- Allow for different investment options close to or after retirement
- Allow inputs to be adjusted so the member can model 'what if' scenarios
- Allow results to be stored for future reference and progress checks
As the member experience moves more and more online, the best funds will find innovative ways to link benefit statements to calculators where the up-to-date member data is pre-populated. All the more reason, therefore, to ensure that the assumptions used are consistent across all tools and communications.
