Following on from a 1.1% return in July, super funds continued their good start to the 2018/19 financial year with the median growth fund (61 to 80% in growth assets) posting a further 1% gain in August.
The latest solid result was mainly due to continued strength in listed share markets and to currency movements. Australian shares were up 1.4% for the month. International shares gained 1.3% in hedged terms but a lofty 4.1% in unhedged terms, resulting from the decline in the Australian dollar from US$0.74 to US$0.72. On average, super funds currently have about 70% of their international shares exposure unhedged. Listed property also had a good month with Australian and international REITs gaining 2.6% and 1.2%, respectively.
Chant West senior investment research manager Mano Mohankumar says: “Our Growth fund category encompasses the funds in which most Australians have their superannuation. It includes the MySuper default options for those funds that have opted for a ‘traditional’ diversified growth portfolio as well as a number of non-default options that are available to members who make their own investment choice.”
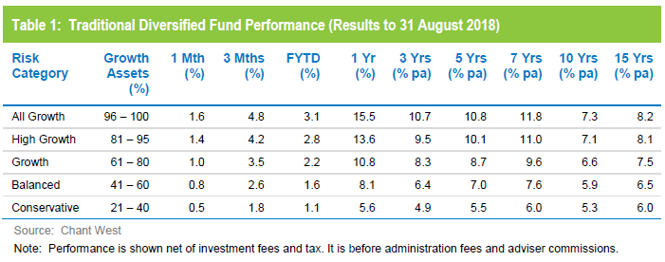
Table 1 compares the median performance for each of the traditional diversified risk categories in Chant West’s Multi-Manager Survey, ranging from All Growth to Conservative. Having recovered from the GFC, all risk categories are now ahead of their long-term return objectives over one, three, five, seven, 10 and 15 years.
Most retail fund default members now in lifecycle products
Mohankumar says, “While our Growth category is still where most people have their super, a meaningful number are now in so-called ‘lifecycle’ products. Most retail funds have adopted a lifecycle design for their default MySuper option. A few not-for-profit funds including some of the larger ones (First State Super, QSuper and Sunsuper) have also gone down the lifecycle path, so overall about a third of MySuper default money is now in a lifecycle product.
“With retail fund lifecycle strategies, members are defaulted into an investment option based on when they were born. They remain in that same option, or ‘cohort’, for the remainder of their membership – that’s unless they actively choose a different option. Allocations to growth assets like shares and property start off high (typically about 90% at younger ages) and reduce gradually over time to an average of about 40% by age 65.
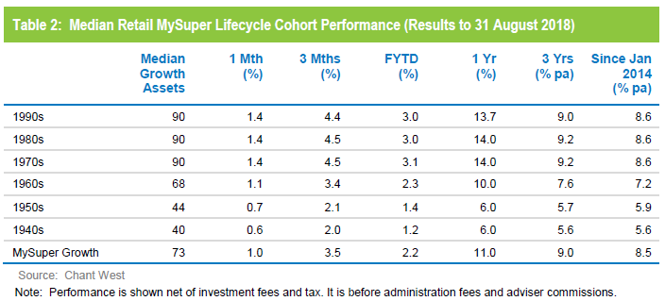
“Because the de-risking takes place progressively within the investment option, it’s difficult to make direct comparisons of the performance of these age-based options with the traditional options that are based on a single risk category. For that reason, we include a separate section in our analysis for these retail lifecycle products. The cohorts that typify these products are generally in 10-year age bands, based on the decade in which the member was born, so there are different options for those born in the 1940s, 1950s, 1960s and so on. Table 2 shows the median performance for each of these cohorts, together with their current median allocation to growth assets.
“As mentioned earlier, some not-for-profit funds have also gone down the lifecycle route, but while the general premise is the same they have gone about it in a different way. In the not-for-profit model members ‘switch’ from one traditional risk category to another at particular ages. The diversified options that underlie these products are included in Table 1.”
As Mohankumar points out, the proliferation of lifecycle products has added a new dimension to what drives member outcomes. “For someone in a traditional default fund, the size of their eventual nest egg is determined by the contributions that go in and the fund’s capability to invest and grow those contributions. With lifecycle products, however, there’s another factor – product design – that comes into play. By product design we mean how the fund changes members’ exposure to growth assets over time – what’s called their ‘glide path’.”
While lifecycle is the most common MySuper default in the retail sector, most not-for-profit funds still use their traditional Growth options for that default role. To illustrate the early results of the lifecycle model, Table 2 includes a row for these traditional MySuper Growth options – mainly, but not all, not-for-profit funds. Caution should be taken when comparing the performance of the retail lifecycle cohorts with the median MySuper Growth option as they are managed differently so the level of risk varies. Nonetheless the table does give an indication of how the different growth asset exposures of the lifecycle cohorts affect their performance.
The past few years have seen strong performance from growth assets so, as you would expect, the options that have higher allocations to growth assets have done best. Since MySuper began in January 2014 younger members of retail lifecycle products – those born in the 1970s, 1980s and 1990s – have held their own compared with the median MySuper Growth fund, but have done so by taking on more equity market risk. Strong returns are especially valuable at younger ages because they create a higher asset base from which growth can compound over the long period to retirement.
Older members – those born in the 1960s or earlier – have underperformed traditional MySuper Growth options by some margin because these older cohorts have taken on less risk. This is because capital preservation becomes more important at those ages so, while they miss out on the full benefit of rising markets, older members in lifecycle strategies are better protected in the event of a market downturn.
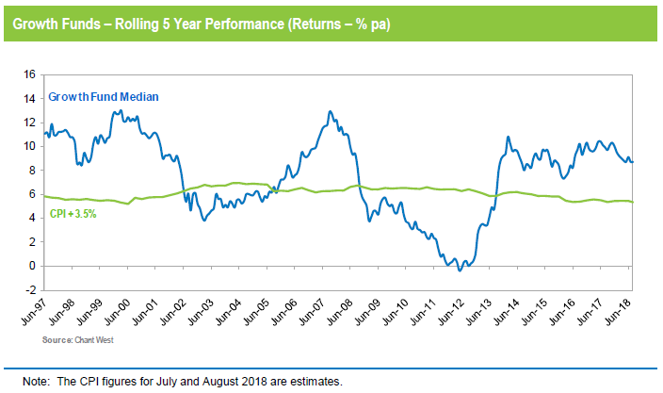
Long-term performance remains above target
MySuper products have been operating for less than five years, so when considering performance it is important to remember that super is a much longer-term proposition. The Chart below compares the performance since July 1992 – the start of compulsory superannuation – of the traditional Growth category median with the typical return objective for that category (CPI plus 3.5% per annum after investment fees and tax over rolling five-year periods). The healthy returns in recent years have seen the five year performance tracking well above that CPI plus 3.5% target for the past five years.