Super funds rose for the second consecutive month in May, with the median growth fund (61 to 80% in growth assets) up 2.2% as share markets continued to rally. With markets also up in June so far, we estimate that the financial year return is sitting at zero mid-way through the month so, remarkably, a positive year remains a real possibility. A final result that is flat or close to flat would be an excellent outcome considering the chaos the world has been thrown into by COVID-19.
Chant West senior investment research manager Mano Mohankumar says: “The surprising share market rally that began in late March came as investors grew more optimistic around coronavirus infection curves flattening around the world, the gradual easing of restrictions and economies tentatively starting to reopen. These signs, together with the liquidity being pumped into the system by central banks, provided some relief after the beating share markets took in February and March. The rally continued into June but has shown some signs of wavering following the US Federal Reserve’s grim outlook for the US economy and concern about a possible second wave of COVID-19 infections.
“From a health perspective we’ve been particularly fortunate in Australia but nevertheless we – along with the global economy – are heading into a recession of unknown depth and duration. Whatever the pattern of the downturn and eventual recovery, share markets are forward-looking and invariably recover faster than economies. However, given the ongoing economic damage, health concerns and the absence of a vaccine, we should expect market volatility to continue, and fund members will need to remain patient and focus on the long-term prospects for their super.
“One key reason that funds appear headed for a better than expected result is that they manage well-diversified portfolios invested across a wide range of growth and defensive asset sectors including, for many, a meaningful allocation to unlisted and alternative assets. That diversification works to cushion the impact during periods of share market weakness. At the same time, with a sizeable allocation of about 57% to listed shares and listed investments in infrastructure and property, funds are able to capture most of the upside when markets turn positive.
“While this financial year’s result may still finish in the red, it’s important to remember that funds have had an unprecedented run since the GFC, returning an impressive 8.4% per annum since the GFC low point in early 2009. That is well ahead of the typical return objective which translates to about 5.5% per annum over the same period.”
Table 1 compares the median performance for each of the traditional diversified risk categories in Chant West’s Multi-Manager Survey, ranging from All Growth to Conservative. Naturally, the large losses over February and March have had a dampening effect, particularly on the shorter-term numbers. However, despite these recent losses, all risk categories have met their typical return objectives over 7, 10 and 15 years.
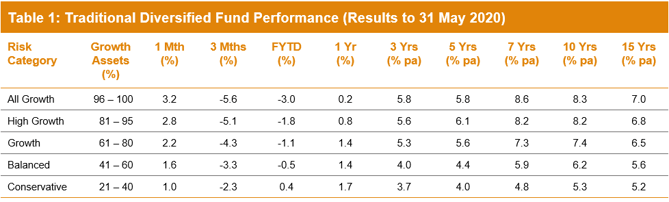
Note: Performance is shown net of investment fees and tax. It is before administration fees and adviser commissions.
Source: Chant West
Lifecycle products behaving as expected
Mohankumar says, “While our Growth category is still where most people have their super invested, a meaningful number are now in so-called ‘lifecycle’ products. Most retail funds have adopted a lifecycle design for their MySuper defaults, where members are allocated to an age-based option that is progressively de-risked as that cohort gets older.”
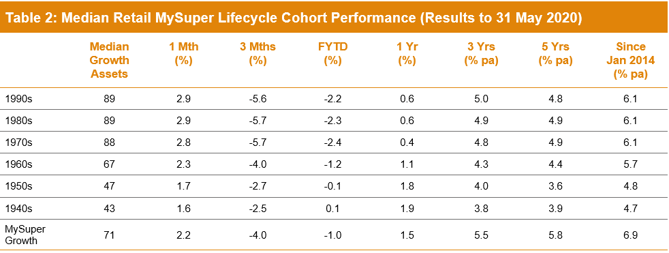
It’s difficult to make direct comparisons of the performance of these age-based options with the traditional options that are based on a single risk category, and for that reason we report them separately. Table 2 shows the median performance for each of the retail age cohorts, together with their current median allocation to growth assets. It also includes a row for traditional MySuper Growth options for comparison – nearly all of which are not-for-profit funds. Care should be taken when comparing the performance of the retail lifecycle cohorts with the median MySuper Growth option, however, as they are managed differently so their level of risk varies over time.
Notes:
1. Performance is shown net of investment fees and tax. It is before administration fees and adviser commissions.
2. January 2014 represents the introduction of MySuper.
Source: Chant West
Despite positive returns in April and May, the setback in February and March has resulted in those options that have higher allocations to growth assets generally faring worse over periods up to one year, the financial year to date and one year. Over longer periods those higher-risk options, which cover the younger cohorts born in the 1960s or later, have generally performed better, although not as well as the median MySuper Growth option.
The reason these younger cohorts in retail lifecycle funds have underperformed the MySuper Growth option is that, while they are generally well-diversified, these funds don’t have the same level of diversification as many of the not-for-profit funds. This is mainly due to the not-for-profit funds’ higher allocations to unlisted assets (unlisted property, unlisted infrastructure and private equity) – about 21% on average. This compares with the retail lifecycle fund average of 5% for these younger cohorts, although there are a few that have 10-14% unlisted asset allocations. These assets have been proven to add value over the long term, not just for their diversification qualities but also because they generate an illiquidity premium in their returns relative to listed markets. However, any performance comparison at the end of May is further complicated by the fact that some funds have devalued their unlisted assets more aggressively than others.
The older cohorts (those born in the 1950s or earlier) are relatively less exposed to growth-orientated assets so you would expect them to underperform the MySuper Growth median over longer periods. Capital preservation is more important at those ages so, while they miss out on the full benefit in rising markets, older members in retail lifecycle options are better protected in the event of a market downturn.
Long-term performance remains above target
MySuper products have only been operating for just over six years, so when considering performance it is important to remember that super is a much longer-term proposition. Since the introduction of compulsory super in 1992, the median growth fund has returned 8% per annum. The annual CPI increase over the same period is 2.4%, giving a real return of 5.6% per annum – well above the typical 3.5% target. Even looking at the past 20 years, which now includes three share major market downturns – the ‘tech wreck’ in 2001–2003, the GFC in 2007–2009 and now COVID-19 – super funds have returned 6.5% per annum, which is ahead of the typical return objective.
Even if the current financial year does finish in negative territory, it would only be the fourth negative year in 28, an average of one every seven years. The typical risk objective for growth funds is no more than one negative year in five, so even if this year is negative it will still be well within the expected risk parameters.
For most of the compulsory super era, funds typically set their return objectives over rolling five-year periods. However, over recent years we’ve seen more and more funds move to re-set their objectives over rolling ten-year periods, which is more consistent with a longer-term focus. We believe it is appropriate for us now to use rolling ten-year performance data when we plot the performance of the median fund versus the typical return objective. The chart below shows that, for the majority of the time, the median growth fund has exceeded its return objective. The exceptions are two periods between mid-2008 and mid-2017, when it fell behind. This is because of the devastating impact of the 16-month GFC period (end-October 2007 to end-February 2009) during which growth funds lost about 26% on average. That impact persists far longer in a rolling 10-year chart than it does in our previous rolling 5-year chart.
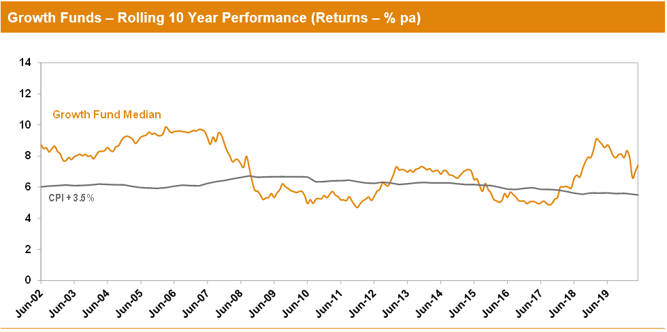
Note: The CPI figure for April and May 2020 are estimates.
Source: Chant West
International share market returns in this media release are sourced from MSCI. This data is the property of MSCI. No use or distribution without written consent. Data provided “as is” without any warranties. MSCI assumes no liability for or in connection with the data. Product is not sponsored, endorsed, sold or promoted by MSCI. Please see complete MSCI disclaimer.
