Investor concerns over the spread of COVID-19 prompted a widespread sell-off in share and property markets, resulting in the median growth fund (61 to 80% in growth assets) falling 3.1% in February. Since then, the virus has spread at an exponential rate. Major share markets reversed from bull to bear phase in an unprecedented three weeks, and we estimate that the median growth fund is down a further 10.5% over March to date. However, with markets whipsawing from session to session and even within a day's trading session, this figure is fluctuating every day.
In February, Australian shares slid 7.8%. International shares, meanwhile, were down 8.1% in hedged terms but the depreciation of the Australian dollar (down from US$0.67 to US$0.65) limited the loss to 4.9% in unhedged terms. Listed property was also down for the month, with Australian and global REITs losing 5.1% and 8.1%, respectively. Bonds – the traditional defensive asset sector – provided some modest cushioning, with Australian and global bonds up 0.9% and 1.2%, respectively.
Chant West senior investment research manager Mano Mohankumar says: "The rapid spread of the virus and fears over its impact on the global economy have ravaged share markets over the past three weeks. That has fed through to the performance of super funds, though perhaps not to the extent that some people might have feared.
"Growth funds, which is where most Australians have their superannuation invested, hold diversified portfolios that are spread across a wide range of growth and defensive asset sectors. This diversification works to cushion the blow during periods of share market weakness. So while Australian and international shares are down at least 27% since the end of January, the median growth fund’s loss has been limited to about 13%. This is still a material reduction in account balances, but it comes on the back of the tremendous run funds have had since the end of the GFC. From the GFC low point in early 2009 to the end of January 2020, the median growth fund averaged a staggering 9.3% per annum – well ahead of the typical long-term return objective of 5.5% to 6% per annum. The current sell-off has obviously eaten into that long-term average gain, but funds are still performing well ahead of their objectives since the end of the GFC.
"The key message to members is not to take panic measures they might regret later. It's too early to tell what the full economic impact of the virus will be, and trying to time markets now is a very risky proposition. The negative returns we've seen in recent weeks are 'unrealised' losses, so you don't actually lock them in unless you take your money out or switch to a lower risk option. If you do that, then not only do you turn those paper losses into real ones but you also miss out on the market rebound which will come sooner or later. Even in the case of older members, most don't take out all their super when they retire so their money remains in the system in the pension phase, often long after retirement. So we encourage everyone to remember that superannuation is indeed a long-term investment, and if the investment option you are in suited you two months ago then it is most likely the one to stick with now."
Table 1 compares the median performance for each of the traditional diversified risk categories in Chant West's Multi-Manager Survey, ranging from All Growth to Conservative.
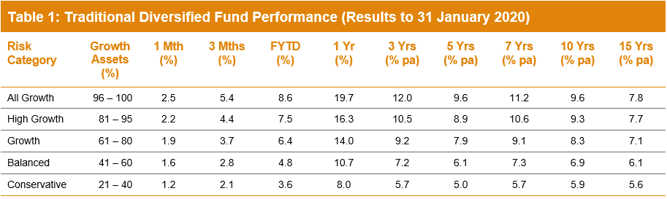
Note: Performance is shown net of investment fees and tax. It is before administration fees and adviser commissions.
Source: Chant West
Lifecycle products behaving as expected
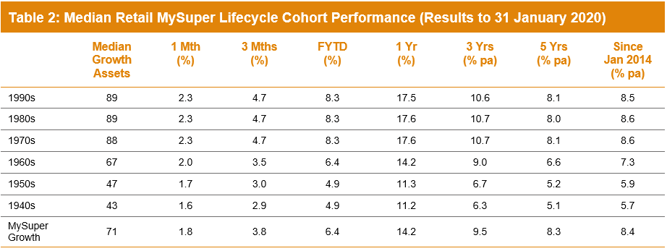
Mohankumar says, "While our Growth category is still where most people have their super invested, a meaningful number are now in so-called 'lifecycle' products. Most retail funds have adopted a lifecycle design for their MySuper defaults, where members are allocated to an age-based option that is progressively de-risked as that cohort gets older."
It's difficult to make direct comparisons of the performance of these age-based options with the traditional options that are based on a single risk category, and for that reason we report them separately. Table 2 shows the median performance for each of the retail age cohorts, together with their current median allocation to growth assets.
Notes:
1. Performance is shown net of investment fees and tax. It is before administration fees and adviser commissions.
2. January 2014 represents the introduction of MySuper.
Source: Chant West
While lifecycle is the most common MySuper default in the retail sector, most not-for-profit funds still use their traditional growth options as their default investment option. A few not-for-profit funds have gone down the lifecycle path, however, and while the general premise is the same the way it is implemented is different. Rather than allocating members to age-based cohorts as retail funds do, in the not-for-profit lifecycle model members typically 'switch' from one traditional risk category to another at particular ages. The diversified options that underlie these strategies are included in Table 1.
To help illustrate the early results of the retail lifecycle model, Table 2 includes a row for traditional MySuper Growth options – mainly, but not all, not-for-profit funds. Care should be taken when comparing the performance of the retail lifecycle cohorts with the median MySuper Growth option, however, as they are managed differently so their level of risk varies over time.
We have mostly seen strong performance from growth assets in recent years so, as we would expect, the options that have higher allocations to growth assets have generally done best over periods greater than one year. However, younger members of retail lifecycle products – those born in the 1970s, 1980s and 1990s – have experienced greater losses in February than the MySuper Growth median (and would have experienced much greater losses in March to date).
The older age cohorts (those born in the 1950s or earlier) are relatively less exposed to growth-orientated assets. Capital preservation is more important at those ages so, while they miss out on the full benefit in rising markets, older members in retail lifecycle options are better protected in the event of a market downturn such as the one we're currently experiencing. These members would have been protected against the market falls more than members in other MySuper options.
Long-term performance remains above target
MySuper products have only been operating for six years, so when considering performance it is important to remember that super is a much longer-term proposition. The chart below compares the performance since July 1992 – the start of compulsory superannuation – of the traditional Growth category median with the typical return objective for that category (CPI plus 3.5% per annum after investment fees and tax over rolling five-year periods). The chart shows performance to 29 February 2020. The healthy returns since the end of the GFC in early 2009 have seen the longer-term performance tracking well above that CPI plus 3.5% target for the past six years.
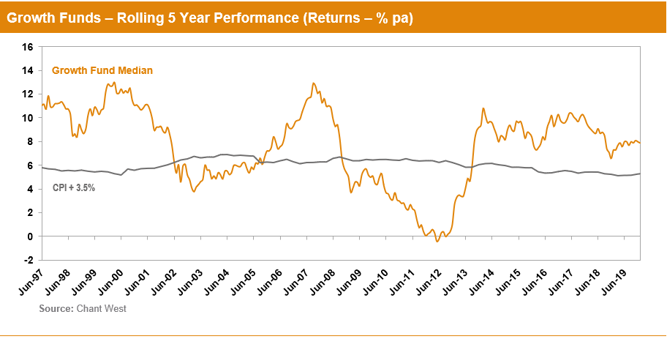
Note: The CPI figures for January and February 2020 are estimates.
International share market returns in this media release are sourced from MSCI. This data is the property of MSCI. No use or distribution without written consent. Data provided “as is” without any warranties. MSCI assumes no liability for or in connection with the data. Product is not sponsored, endorsed, sold or promoted by MSCI. Please see complete MSCI disclaimer.
