Super funds have defied the gloomy expectations of a year ago and put in another impressive performance in calendar 2017. At a time when most other forms of saving were offering 3% returns or less – barely above the rate of inflation – the median growth fund returned a remarkable 10.8%.
2017 was the sixth consecutive year of positive returns – the first time that has happened since 1996 – 2001. The annualised return from January 2012 to December 2017 was 10.3%, which is 8.4% above the rate of inflation and well ahead of the typical performance target of CPI + 3.5% per annum.
These are the sorts of numbers that members need to hear. They give funds a golden opportunity to get the message out that super is a great way to save and bolster confidence in superannuation.
Confidence in super, as we have said before, is important on several levels. Firstly, it encourages members to do what is often the best thing they can with their discretionary savings which is to make voluntary super contributions, either directly or by salary sacrifice. Past returns are not, of course, an indicator of future returns and the current bull run will end at some time, but members will be far more inclined to contribute voluntarily if their awareness of the recent strong returns gives them the confidence to do so. Not only that, they will be more likely to leave their money in growth options and avoid knee-jerk conservative switches that will hurt them in the long run.
Secondly, members won’t engage fully (or at all) with their fund unless they have confidence in the superannution system as a whole. If they don’t engage they won’t make informed decisions which means their eventual nest eggs are likely to be smaller than they should have been.
That in turn will have consequences at the national economic level because lower super balances lead to a greater reliance on the Age Pension and a greater tax burden for current and future taxpayers.
If we think back to the beginning of 2017 there was every reason to expect very little from the year ahead. The UK’s Brexit decision had thrown Europe into turmoil, Donald Trump’s shock election had raised serious concerns about the implications of his isolationist policies for the US economy, and almost every fund manager was reporting that growth assets were close to or fully valued and that there were no obvious sources of real returns.
Uncertainty was rife yet share markets globally, led by the US, started rising and continued to rise. So much so that, over the year as a whole, international shares rose 18.7% in hedged terms and 13.4% unhedged while Australian shares rose 11.9%. Chart 1 shows the cumulative growth over the year for Australian shares, international shares hedged and international shares unhedged which are represented by the S&P/ASX 300, MSCI World Ex Australia Local and MSCI World Ex Australian (A$) Indices, respectively.

Other listed markets were strong, too. Global REITs rose 8.2%, Australian REITs a more modest 6.4% and global listed infrastructure 14.8%. Unlisted assets were also strong contributors to the overall result with unlisted property gaining 9.9%, unlisted infrastructure 15.0% and private equity 18.1%.
The recent sequence of positive return years, while unusual, extends a success story that dates back to July 1992, the start date of compulsory superannuation. We now have performance data going back more than a quarter of a century – more than half the typical working lifetime – and despite the vagaries of financial markets super funds have more than delivered on their promises to members.
In the dominant Growth category (61 to 80% growth assets), which is still where most members’ money is invested, the median return over that 25½ years is 8.4% per annum. That compares with the annual CPI increase of 2.5%, so the real return above inflation has been a remarkable 5.9% per annum.
That’s an excellent result by any account, and well ahead of the funds’ own objective which, typically, is to beat inflation by 3% to 4% per annum. That is illustrated in Chart 2 which compares the Growth category median with its average return objective (CPI plus 3.5% per annum after investment fees and tax over rolling five year periods).

Returns are important but so too is risk. Funds are now required to publish a standard risk measure, which is their guidance as to the likely number of negative returns in any 20 year period. Typically for growth funds the number is about four. Chart 3 shows that there were just four negative returns over the entire 25 calendar years since the introduction of compulsory superannuation. Therefore, funds have also achieved their risk targets.

While most of the focus is on Growth funds, it is important to look at other risk categories as well. With many funds introducing ‘lifecycle’ products, members are increasingly being moved through different risk categories automatically according to their age. Typically, younger members will start off in a High Growth option (81 to 100% growth assets) and remain there perhaps until their late 30s or early 40s. An 18 year old, therefore, could spend longer in High Growth than Growth over the course of their membership.
The higher exposure to growth assets should result in higher returns, albeit with higher risk. Our data for the High Growth category goes back 22½ years to July 1995. Over that period, the median return has been 7.8% per annum while the CPI increase has averaged 2.5%, so the real return has been 5.3%.
The typical return objective for this category is CPI + 4.5% per annum on average over rolling 5 year periods. Chart 4 shows that, leading up to the GFC, High Growth funds performed above that target line. Compared with Growth funds, they were harder hit during the GFC and for about five years they tracked below the line. More recently, with the GFC period having worked its way out of the calculations, they have again resumed their above-target performance.

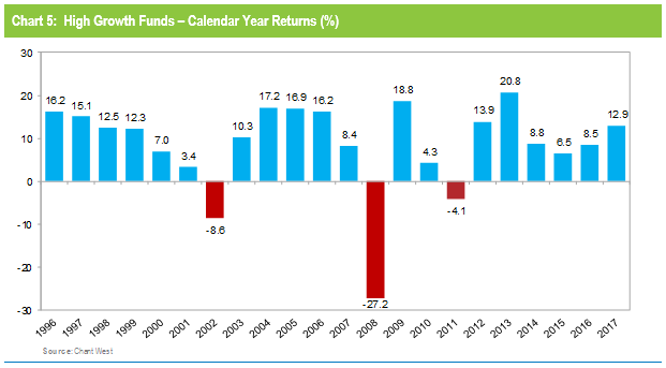
High Growth funds have higher risk expectations as well. In terms of the standard risk measure, the typical expectation is for about five negative years in any 20 year period. Chart 5 shows that there have been only three negative returns during the 22 complete calendar years to December 2017, so again the risk objective has been comfortably achieved.
Finally, we will look at the Conservative category, which we define as having a 21 to 40% allocation to growth assets. This is the category that members often switch to – automatically in the case of lifecycle members – in the lead-up to retirement because it provides more protection against adverse market movements.
The typical return objective for Conservative funds is is to beat inflation by 2% per annum over rolling three year periods. Chart 6 shows that this objective has been achieved for the great majority of time, largely because Conservative funds escaped the worst of the GFC. Over the full 25 year period of compulsory super the median Conservative fund has returned 6%, a real return of 3.5% above inflation.

Chart 7 shows that this category has experienced only two negative returns in the entire 25 year period. So this category, too, achieved its typical risk objective which is two or three negative years in any 20 year period.

To sum up, Australia’s major super funds have continued to do what they set out to do. Since the advent of compulsory superannuation over a quarter of a century ago, they have delivered on their promises to members by growing their wealth in real terms while protecting them from undue risk. This is a strong message, and one worth promoting at every opportunity.
