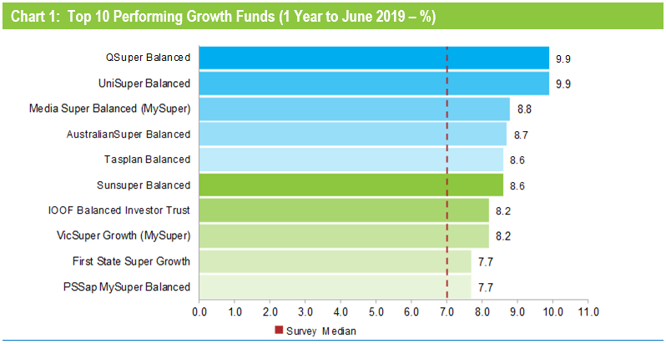
Super funds have delivered a record-breaking 10th consecutive positive financial year return, with the median growth fund up 7% in the year to 30 June 2019. QSuper and UniSuper tied for top spot for the year, returning a very impressive 9.9%. Even the worst performer in our growth category returned 4.3%. Growth funds are those that have a 61 to 80% allocation to growth assets and are the ones in which most Australians are invested.
Chant West senior investment manager Mano Mohankumar says: "Fund members should be very pleased with the 2018/19 return of 7%. It's better than what most experts predicted a year ago and it's about 5.5% above the current rate of inflation – well above the typical long-term objective which is to beat inflation by 3.5%.
"While this year's result hasn't reached the heights of some recent years, the average return over the past 10 financial years (including this one) has been 8.8% per annum. That's a tremendous run, but we should remember that it partly represents the recovery from the GFC, which produced two consecutive financial year losses in 2007/08 and 2008/09. So it would be a mistake to assume that the level of returns we've seen recently is sustainable. Indeed, with many asset sectors looking to be fully valued or close to it, we're expecting some challenging times ahead.
"It was an interesting year in that all asset sectors produced positive returns and the dispersion of returns across most major sectors wasn't as wide as it normally is. Highlighting this is the fact that QSuper and UniSuper, who were equal top performers in our growth category, achieved that performance with vastly different investment portfolios. This supports our assertion that there is no single best approach to investing. QSuper and UniSuper have executed their strategies well not just this year but for many years, which is why both funds have been among the top performers over the long term.
"QSuper, like most not-for profit funds, has a meaningful allocation to unlisted assets such as property, infrastructure and private equity. However, where its strategy is unique is that it further smooths out returns for members by investing significantly less in listed shares than other funds. Against that, it maintains a significant allocation to long duration bonds which carry sharemarket-like risk but are a better diversifier against sharemarket falls than traditional bonds.
"UniSuper, in contrast, has a strong focus on listed assets. Unlike most other not-for-profit funds, it has very little invested in unlisted assets. Instead, it prefers to gain its exposure to property and infrastructure by taking large stakes in high quality listed companies. UniSuper believes that taking this listed market route has enabled it to be opportunistic in building a portfolio of higher quality property and infrastructure assets at attractive prices."
Chart 1 shows the year's top 10 performing growth options over the 2018/19 financial year.
Source: Chant West
Notes:
1. Where a super fund has more than one investment option in the Growth category, only its main investment option has been included in the top 10.
2. Performance is shown net of investment fees and tax. It is before administration fees and adviser commissions.
Other key content:
- Diversified fund performance by risk category
- Top 10 performing growth funds over 10 years
- Retail lifecycle product performance
- Long-term performance including rolling 5 year returns chart
- Risk objectives and calendar year by year performance chart
- Asset sector performance
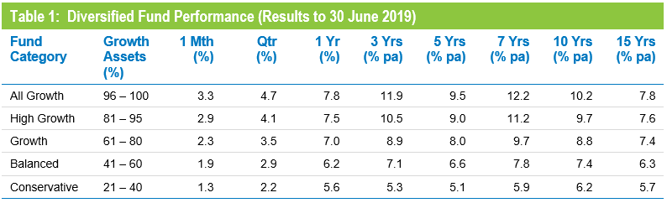
Table 1 compares the median performance for each fund category in Chant West's Multi-Manager Survey, ranging from All Growth to Conservative. Over every period shown, all risk categories have met their typical long-term return objectives, which range from CPI + 2% for Conservative funds to CPI + 4.75% for All Growth.
Source: Chant West
Note: Performance is shown net of investment fees and tax. It is before administration fees and adviser commissions.
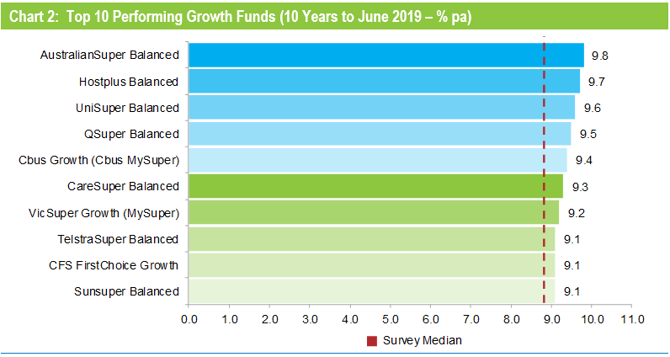
Chart 2 shows the top 10 performing growth options over 10 years.
Source: Chant West
Notes:
1. Where a super fund has more than one investment option in the Growth category, only its main investment option has been included in the top 10.
2. Performance is shown net of investment fees and tax. It is before administration fees and adviser commissions.
Lifecycle funds operating as designed
Mohankumar says, "While our Growth category is still where most people have their super, a meaningful number are now in so-called 'lifecycle' products. Most retail funds have adopted a lifecycle design for their MySuper defaults, where members are allocated to an age-based option that is progressively de-risked as that cohort gets older.
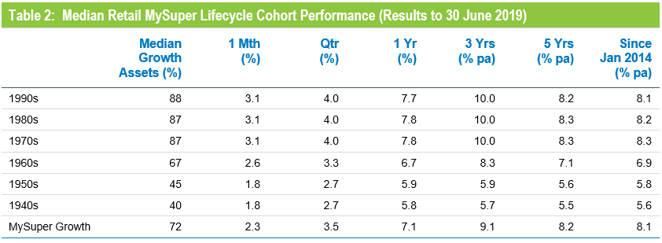
"It's difficult to make direct comparisons of the performance of these age-based options with the traditional options that are based on a single risk category, and for that reason we report them separately. Table 2 shows the median performance for each of the retail age cohorts, together with their current median allocation to growth assets."
Source: Chant West
Note: Performance is shown net of investment fees and tax. It is before administration fees and adviser commissions.
While lifecycle is the most common MySuper default in the retail sector, most not-for-profit funds still use their traditional growth options for that default role. A few have gone down the lifecycle path, however, and while the general premise is the same the way it is implemented is different. Rather than allocating members to age-based cohorts as retail funds do, in the not-for-profit lifecycle model members typically 'switch' from one traditional risk category to another at particular ages. The diversified options that underlie these strategies are included in Table 1.
To help illustrate the early results of the retail lifecycle model, Table 2 includes a row for traditional MySuper Growth options – mainly, but not all, not-for-profit funds. Care should be taken when comparing the performance of the retail lifecycle cohorts with the median MySuper Growth option, however, as they are managed differently so their level of risk varies over time.
We have generally seen strong performance from growth assets in recent years so, as we would expect, the options that have higher allocations to growth assets have generally done best. Younger members of retail lifecycle products – those born in the 1970s, 1980s and 1990s – finished the 2018/19 financial year ahead of the median MySuper Growth fund on average, and have generally held their own over the longer-term. However, they have done so by taking on more sharemarket risk.
The older age cohorts (those born in the 1960s or earlier) are less exposed to share market risk. Capital preservation is more important at those ages so, while they miss out on the full benefit in rising markets, older members in retail lifecycle options should be better protected in the event of a market downturn.
Funds still delivering on long-term targets
While 2018/19 was another good year, Mohankumar reminds fund members to think long term. "By all means look at what your fund delivered over the year, but it's even more important to know what its long-term objectives are and whether it's achieving them. Most growth funds aim to beat inflation by 3% to 4% a year. We now have data going back 27 years to July 1992, the start of compulsory super. Over that period, the annualised return is 8.3% and the annual CPI increase is 2.5%, giving a real return of 5.8% per annum – well above that 3% to 4% target. Even removing the particularly strong years from the early to mid-1990s as we came out of recession and looking at the past 20 years, super funds have returned 7.2% per annum – 4.6% above inflation. Let's not forget that the 20 year return still includes two sharemarket downturns – the 'tech wreck' and the GFC.
"The strong long-term performance is borne out visually in Chart 3, which compares the growth category median with the average return objective of CPI plus 3.5% per annum over rolling five year periods – that's after investment fees and tax. Until 2009, the median fund outperformed the target most of the time. The GFC brought that to an abrupt halt, and the median dipped below the target line for several years. Now, with the GFC period out of the calculation, the five year return has been tracking well above the target line for nearly six years."
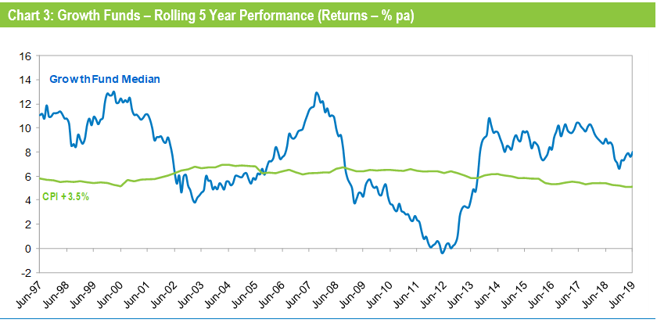
Source: Chant West
Note: The CPI figure for the June 2019 quarter is an estimate.
Returns are important but risk matters too
Mohankumar says: "Returns are important but so is risk, and most funds also set themselves a risk objective. Risk is normally expressed as the likelihood of a negative annual return, and typically a growth fund would aim to post no more than one negative return in five years on average. Chart 4 plots the year by year performance of the median growth fund over the 27 financial years since the introduction of compulsory super. The objective would be no more than five negative years in that time. As it turns out there have only been three, so the risk objective has been met as well as the performance objective.
"Over the longest period we can measure Australia's major super funds have delivered on their promises to members, growing their wealth in real terms while protecting them from undue risk. That's a great achievement, and it's an important message their members should be aware of, too."
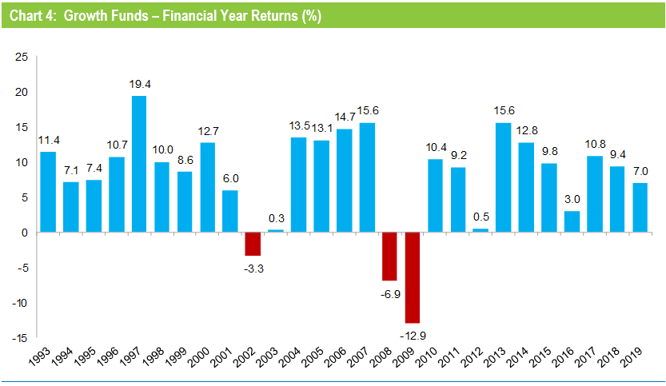
Source: Chant West
Note: Performance is shown net of investment fees and tax. It does not include administration fees or adviser commissions.
The investments that drove the performance
While there are differences between funds' investment strategies, even within the same risk category, most of their performance is driven by what happens in the major investment markets.
Table 3 shows the performance of all the main asset sectors over different time periods to the end of June 2019. We have used market indices for all sectors other than private equity. For this sector, we have used the returns of a major fund in our survey that are representative of those markets.
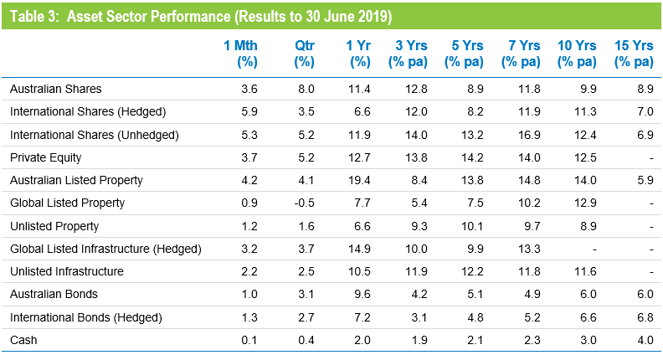
Source: Chant West
The key points to note for the 2018/19 financial year are:
- Australian shares were up a healthy 11.4%
- Hedged international shares returned 6.6%. However, the depreciation of the Australian dollar (down from US$0.74 to US$0.70), propelled the return in unhedged terms to an impressive 11.9%
- Australian listed property was the strongest performing asset sector over the year, returning 19.4% while global returned 7.7%. Unlisted property returned 6.6%
- Unlisted infrastructure and private equity, while not quite at the heights of some recent years, had another solid year, up 12.7% and 10.5%, respectively. Global listed infrastructure had an even better year returning 14.9%
- In the traditional defensive asset sectors, bonds had an excellent year, with Australian bonds up 9.6% and global bonds gaining 7.2%. With interest rates at an all-time low, it's not surprising that cash was the worst performing sector with a return of just 2%.
