Super funds continued their relentless rise in May, with the median growth fund (61 to 80% in growth assets) returning 1.1% for the month. This brought the return for the first 11 months of the financial year to a stunning 15.7%. And with markets up in June so far we estimate that, with about two weeks of the year remaining, the cumulative return is now sitting at 17.5%.
Chant West Senior Investment Research Manager, Mano Mohankumar says that super fund members who held their nerve and remained patient through the COVID crisis have been rewarded with one of the strongest years in the compulsory super era. "Should growth funds finish the year at or around the current level, it would represent the highest annual return in 24 years. The last time we saw a higher annual result was all the way back in 1996/97 when growth funds returned 19.4%.
"The past two financial years really have illustrated the strength and resilience of our leading super funds. Despite the massive hit that COVID delivered to financial markets last year, the diversification built into growth funds enabled them to limit the damage, and the small loss of 0.6% for FY20 was far better than expected. And this year, with a little over 50% allocated to listed shares, these funds have been able to capture a meaningful proportion of the upside as markets staged their remarkable recovery.
"The cumulative return since the COVID low point at end-March last year is now about 25%, which is amazing given the chaos the world was thrown into by COVID-19. We're now sitting about 10% above the pre-COVID crisis high that was reached at the end of January 2020.
"May was another good month for share markets, which are the main drivers of growth fund performance. Australian shares were up 2.3% while international shares were up 1% in hedged terms and 1.2% unhedged. Notably, both the Australian and US market indices reached all-time record highs during the month.
"In the US, there was some nervousness about rising inflation but this was more than offset by optimism around the pace of vaccine rollouts and ongoing fiscal stimulus measures. In addition, US companies had a strong quarterly earnings season. In the UK, there was a rise in confidence with further easing of lockdown measures and the staged re-opening of the economy. In the eurozone, the pace of vaccine rollout gained momentum while restrictions were generally eased further.
"Back at home, despite the restrictions Victorians have endured recently, all states now have new virus case numbers largely under control. Additionally, we've seen a general increase in the take-up of vaccinations. As the economy slowly returns towards normal (Victoria being the exception) we've also seen an increasing number of workers returning to their offices for at least some of the working week."
Table 1 compares the median performance for each of the traditional diversified risk categories in Chant West's Multi-Manager Survey, ranging from All Growth to Conservative. Over 3, 5, 7, 10 and 15 years, all risk categories have met their typical long-term return objectives, which range from CPI + 2% for Conservative funds to CPI + 4.25% for All Growth.
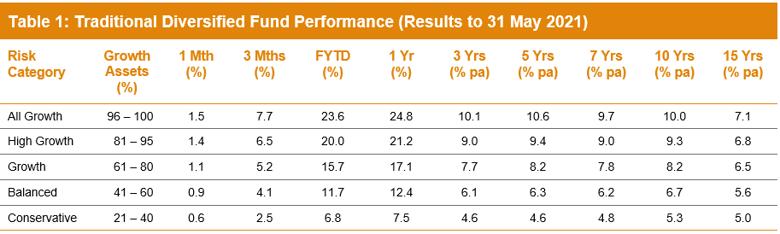
Note: Performance is shown net of investment fees and tax. It is before administration fees and adviser commissions.
Source: Chant West
Lifecycle products behaving as expected
Mohankumar says that while the Growth category is still where most people have their super invested, a meaningful number are now in so-called 'lifecycle' products. Most retail funds have adopted a lifecycle design for their MySuper defaults, where members are allocated to an age-based option that's progressively de-risked as that cohort gets older.
It's difficult to make direct comparisons of the performance of these age-based options with the traditional options that are based on a single risk category, and for that reason we report them separately. Table 2 shows the median performance for each of the retail age cohorts, together with their current median allocation to growth assets. For comparison purposes it also includes a row for traditional MySuper Growth options – nearly all of which are not-for-profit funds. Care should be taken when comparing the performance of the retail lifecycle cohorts with the median MySuper Growth option, however, as they're managed differently so their level of risk varies over time.
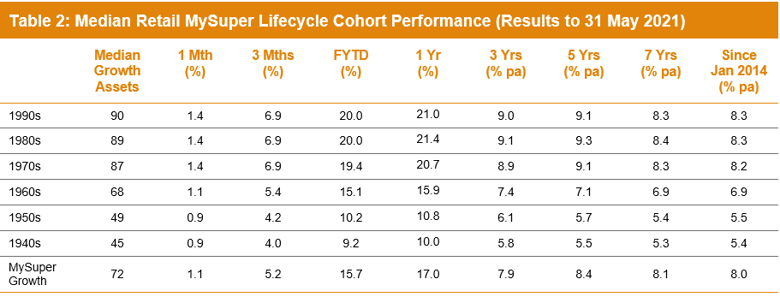
Notes:
1. Performance is shown net of investment fees and tax. It is before administration fees and adviser commissions.
2. January 2014 represents the introduction of MySuper.
Source: Chant West
As a result of the strong recovery since the end of March last year, the options that have higher allocations to growth assets have now done better over all periods shown. Younger members of retail lifecycle products – those born in the 1970s, 1980s and 1990s – have outperformed the MySuper Growth median over all periods shown. However, they've done so by taking on significantly more share market risk. On average, these younger cohorts have at least 20% more invested in listed shares and listed real assets than the typical MySuper Growth option.
The older cohorts (those born in the 1960s or earlier) are relatively less exposed to growth assets so you would expect them to underperform the MySuper Growth median over longer periods. Capital preservation is more important at those ages, so while they miss out on the full benefit in rising markets, older members in retail lifecycle options are better protected in the event of a market downturn.
Long-term performance remains above target
MySuper products have only been operating for just over seven years, so when considering performance it’s important to remember that super is a much longer-term proposition. Since the introduction of compulsory super in 1992, the median growth fund has returned 8.1% pa. The annual CPI increase over the same period is 2.4%, giving a real return of 5.7% pa – well above the typical 3.5% target. Even looking at the past 20 years, which now includes three share major market downturns – the 'tech wreck' in 2001–2003, the GFC in 2007–2009 and COVID-19 in 2020 – the median growth fund has returned 6.8% pa, which is still well ahead of the typical return objective.
The chart below shows that, for the majority of the time, the median growth fund has exceeded its return objective over rolling 10-year periods, which is a commonly used timeframe consistent with the long-term focus of super. The exceptions are two periods between mid-2008 and late-2017, when it fell behind. This is because of the devastating impact of the 16-month GFC period (end-October 2007 to end-February 2009) during which growth funds lost about 26% on average.
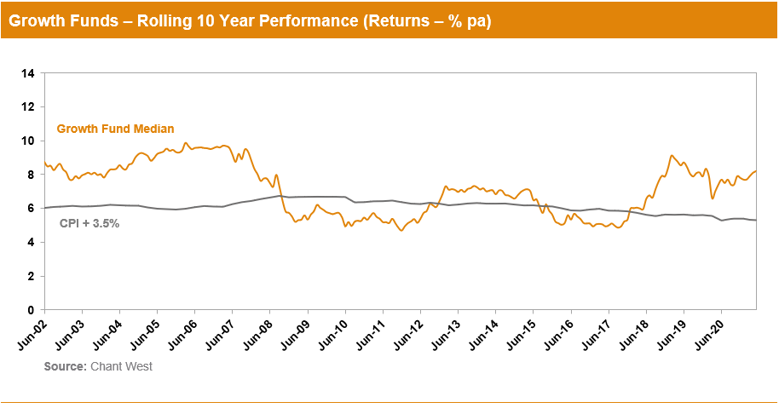
Note: The CPI figures for April and May 2021 are estimates.
International share market returns in this media release are sourced from MSCI. This data is the property of MSCI. No use or distribution without written consent. Data provided “as is” without any warranties. MSCI assumes no liability for or in connection with the data. Product is not sponsored, endorsed, sold or promoted by MSCI. Please see complete MSCI disclaimer.
