Super funds have successfully navigated the coronavirus-induced financial crisis to deliver a result that should come as a pleasant surprise for their members. The median growth fund (61 to 80% in growth assets) finished the 2019/20 financial year with a loss of just 0.5%. In fact, nearly half the funds in our growth category managed to generate a positive return, albeit a small one, despite the worst economic conditions since the GFC
Chant West senior investment manager Mano Mohankumar says: “It was a topsy turvy year that can be split into three parts. Over the first seven months to January, growth funds gained an impressive 6.4%. Then over February and March, the seriousness of the COVID-19 pandemic and its likely impact on the global economy saw share markets take a severe beating, and funds gave up a staggering 12% in just a few weeks. However, a surprisingly sharp share market rally over the June quarter saw them bounce back 6.5% to finish the year virtually flat.
“While the end result was marginally negative, that still represents an excellent outcome given the economic damage wrought by the COVID-19 pandemic in Australia and globally. And it’s important to remember that funds had enjoyed an unprecedented run for almost 11 years through to early 2020. Even taking this year’s result into consideration, growth funds have returned an impressive 8.3% per annum since the GFC low point in early 2009. That’s well ahead of their typical return objective which equates to about 5.6% per annum.
“A key reason for the better than expected financial year result is that our super funds are so well diversified in their investment portfolios. Shares remain the main contributors to performance with about 25% allocated to Australian shares and 29% to international shares on average. But that still leaves another 46% invested across other growth and defensive asset sectors. That diversification works to cushion the impact during periods of share market weakness. As an example, Australian shares were down 7.6% over the year and Australian listed property fared worse, losing 20.7%, but international shares and Australian and international bonds were all up by about 4 or 5%, enabling funds to post a near-flat return overall.”
The better performing funds over the year were generally those that had lower allocations to Australian shares and higher allocations to international shares and bonds. Funds would also have benefited from having low exposure to listed property and listed infrastructure.
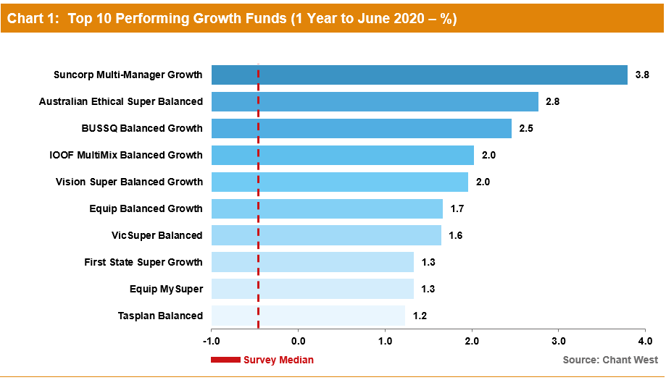
Chart 1 shows the year’s top 10 performing growth options over the 2019/20 financial year, together with the survey median.
Notes:
1. For inclusion in the Top 10, an investment option that is not a fund’s main option in the Growth category must meet a minimum size requirement of $1 billion.
2. Performance is shown net of investment fees and tax. It is before administration fees and adviser commissions.
Table 1 compares the median performance for each fund category in Chant West’s Multi-Manager Survey, ranging from All Growth to Conservative. Over 5, 7, 10 and 15 years, all risk categories have met their typical long-term return objectives, which range from CPI + 2% for Conservative funds to CPI + 4.75% for All Growth.
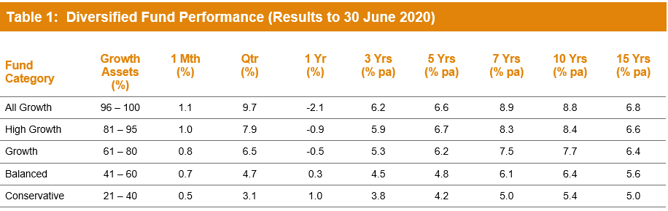
Note: Performance is shown net of investment fees and tax. It is before administration fees and adviser commissions.
Source: Chant West
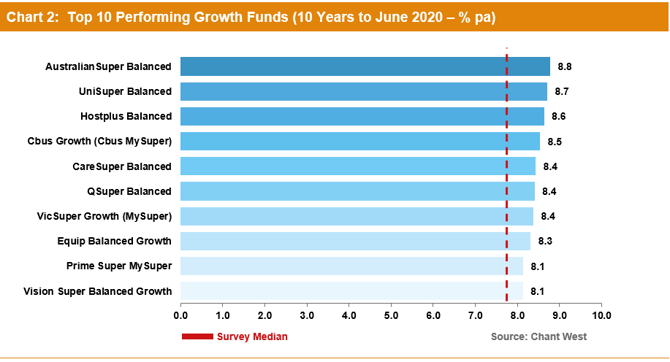
Chart 2 shows the top 10 performing growth options over 10 years, together with the survey median.
Notes:
1. For inclusion in the Top 10, an investment option that is not a fund’s main option in the Growth category must meet a minimum size requirement of $1 billion.
2. Performance is shown net of investment fees and tax. It is before administration fees and adviser commissions.
Lifecycle funds operating as designed
Mohankumar says, “While our Growth category is still where most people have their super invested, a meaningful number are now in so-called ‘lifecycle’ products. Most retail funds have adopted a lifecycle design for their MySuper defaults, where members are allocated to an age-based option that is progressively de-risked as that cohort gets older.”
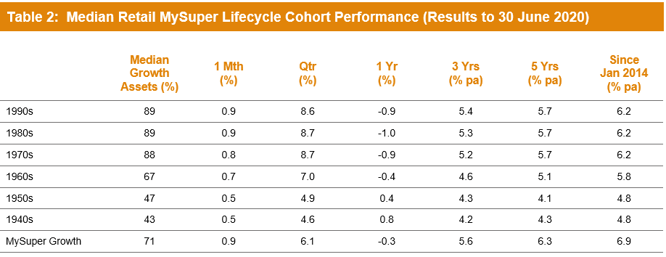
It’s difficult to make direct comparisons of the performance of these age-based options with the traditional options that are based on a single risk category, and for that reason we report them separately. Table 2 shows the median performance for each of the retail age cohorts, together with their current median allocation to growth assets. It also includes a row for traditional MySuper Growth options for comparison – nearly all of which are not-for-profit funds. Care should be taken when comparing the performance of the retail lifecycle cohorts with the median MySuper Growth option, however, as they are managed differently so their level of risk varies over time.
Notes:
1. Performance is shown net of investment fees and tax. It is before administration fees and adviser commissions.
2. January 2014 represents the introduction of MySuper.
Source: Chant West
Despite a strong June 2020 quarter, the major setback in February and March has resulted in those options that have higher allocations to growth assets generally faring slightly worse over the financial year. Over longer periods those higher-risk options, which cover the younger cohorts born in the 1960s or later, have generally performed better, although not as well as the median MySuper Growth option.
The reason these younger cohorts in retail lifecycle funds have underperformed the MySuper Growth option is that, while they are generally well-diversified, these funds don’t have the same level of diversification as many of the not-for-profit funds. This is mainly due to the not-for-profit funds’ higher allocations to unlisted assets (unlisted property, unlisted infrastructure and private equity) – about 21% on average. This compares with the retail lifecycle fund average of 5% for these younger cohorts, although there are a few that have 10-14% unlisted asset allocations. These assets have been proven to add value over the long term through the illiquidity premium in their returns relative to listed markets while providing great diversification benefits which help to smooth returns for fund members.
The older cohorts (those born in the 1950s or earlier) are relatively less exposed to growth-orientated assets so you would expect them to underperform the MySuper Growth median over longer periods. Capital preservation is more important at those ages so, while they miss out on the full benefit in rising markets, older members in retail lifecycle options are better protected in the event of a market downturn, as was evident during the past year.
Funds still delivering on long-term targets
While the 2019/20 result fell short of the returns of the previous ten years, Mohankumar reminds fund members to think long term. “Certainly look at what your fund delivered over the year, but it’s even more important to know what its long-term objectives are and whether it’s achieving them. Most growth funds aim to beat inflation by 3% to 4% a year. We now have data going back 28 years to July 1992, the start of compulsory super. Over that period, the annualised return is 8% and the annual CPI increase is 2.4%, giving a real return of 5.6% per annum – well above that 3% to 4% target. Even looking at the past 20 years, which now includes three share major market downturns – the ‘tech wreck’ in 2001–2003, the GFC in 2007–2009 and now COVID-19 – super funds have returned 6.3% per annum, which is still ahead of the typical return objective.”
For most of the compulsory super era, funds typically set their return objectives over rolling five-year periods. However, over recent years we’ve seen more and more funds re-set their objectives over rolling 10-year periods. This is more consistent with a longer-term focus, so we now use rolling 10-year data to plot the performance of the median fund versus the typical return objective.
Chart 3 shows that, for the majority of the compulsory super era, the median growth fund has exceeded its return objective. The exceptions are two periods between mid-2008 and mid-2017, when it fell behind. This is because of the devastating impact of the 16-month GFC period (end-October 2007 to end-February 2009) during which growth funds lost about 26% on average. That impact persists far longer in a rolling 10-year chart than it does in our previous rolling five-year chart.
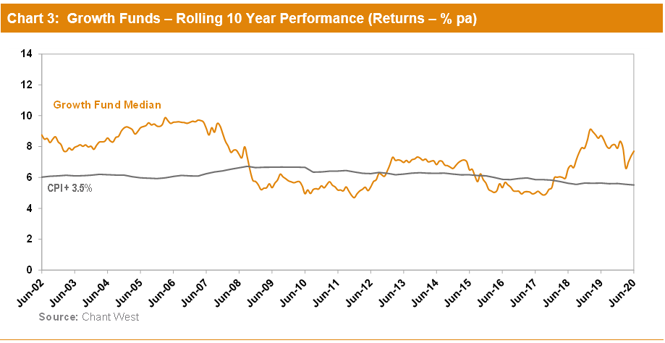
Note: The CPI figure for the June 2020 quarter is an estimate.
Returns are important but risk matters too
Mohankumar says: “Returns are important but so is risk, and most funds also set themselves a risk objective. Risk is normally expressed as the likelihood of a negative annual return, and typically a growth fund would aim to post no more than one negative return in five years on average. Chart 4 plots the year by year performance of the median growth fund over the 28 financial years since the introduction of compulsory super. The negative result for 2019/20 represents only the fourth negative financial year over the entire period, an average of one negative every seven years. So the risk objective has also been comfortably met as well as the performance objective.
“Over the longest period we can measure Australia’s major super funds have delivered on their promises to members, growing their wealth in real terms while protecting them from undue risk. That’s a great achievement, and it’s an important message their members should be aware of, too.”
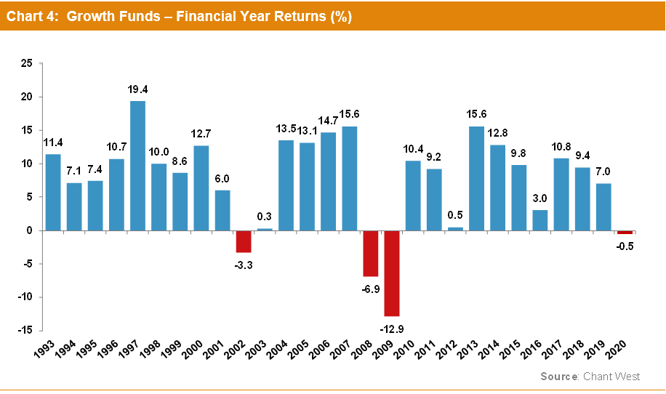
Note: Performance is shown net of investment fees and tax. It does not include administration fees or adviser commissions.
The investments that drove the performance
While there are differences between funds’ investment strategies, even within the same risk category, most of their performance is driven by what happens in the major investment markets.
Table 3 shows the performance of all the main asset sectors over different time periods to the end of June 2020. We have used market indices for all sectors other than private equity. For this sector, we have used the returns of a major fund in our survey that are representative of those markets.
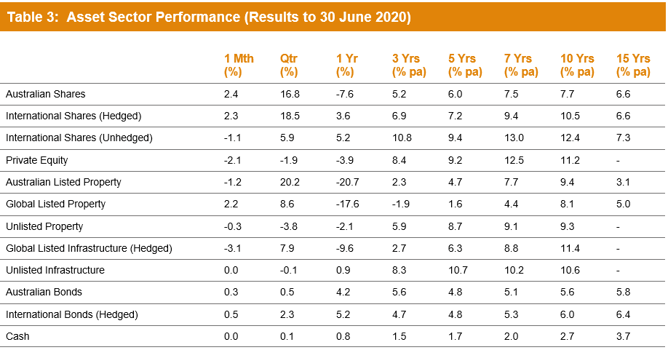
Source: Chant West
The key points to note for the 2019/20 financial year are:
- Australian shares were down 7.6% over the year. However, international shares were up 3.6% in hedged terms and 5.2% unhedged. Private equity, meanwhile, retreated 3.9%.
- Australian listed property was the worst performing asset sector, falling 20.7%, while global listed property lost 17.6%. However, unlisted property only lost 2.1%. Within the unlisted property market the retail sector fared much worse than commercial and industrial, with valuations typically down 15% to 20%, so funds with a higher allocation to retail property would have been hurt more.
- Global listed infrastructure also had a disappointing year, losing 9.6%, while unlisted infrastructure was marginally positive with a return of 0.9%.
- In the traditional defensive asset sectors, bonds played their role as an important diversifier with Australian bonds and international bonds up 4.2% and 5.2%, respectively. With interest rates at an all-time low, it’s not surprising that cash returned just 0.8%.
International share and unlisted property market returns in this media release are sourced from MSCI. This data is the property of MSCI. No use or distribution without written consent. Data provided “as is” without any warranties. MSCI assumes no liability for or in connection with the data. Product is not sponsored, endorsed, sold or promoted by MSCI. Please see complete MSCI disclaimer.
