Super funds weathered a jittery December quarter on world share markets to finish the 2018 calendar year in the black, if only barely. The 0.8% return, while the lowest since 2011, nonetheless extended the run of positive years to seven.
QSuper took top spot for the year, returning 2.8%. But while the median growth fund return was in the black there were several in the category that delivered negative returns, with the worst performer losing 2.5%. Growth funds are those that have a 61 to 80% allocation to growth assets and are the ones in which most Australians are invested.
Chant West senior investment manager Mano Mohankumar says: “The 2018 result doesn’t come as a surprise given the stellar run funds had experienced since early 2009. Leading in to 2018, the median growth fund had averaged close to 9% over the previous nine years and asset managers were saying that most asset sectors were fully priced or close to it, so a flat or negative year was certainly on the cards. The important thing for members to remember is that growth funds are generally designed to beat inflation by 3.5% a year, which translates to about 6% per annum over the long term, and they’ve succeeded in achieving that objective over the medium and long term.
“The power of diversification was clearly evident in 2018. When you consider that the Australian share market fell 3.1% and international shares 7.5%, the median growth fund was still able to eke out a positive return. That’s because, while these funds do invest substantially in shares they also invest in a wide range of other asset sectors including unlisted assets and traditional defensive assets such as bonds and cash, all of which produced positive returns for the year.
“The better performing funds in 2018 were those that had relatively higher allocations to unlisted assets – infrastructure, property and private equity – and to bonds at the expense of shares. Having a higher proportion of your international shares unhedged would have also helped, because the depreciation of the Australian dollar turned the unhedged loss of 7.5% for that sector into a 1.5% gain in unhedged terms.”
Chart 1 shows the year’s top 10 performing growth options, all of which are not-for-profit funds.
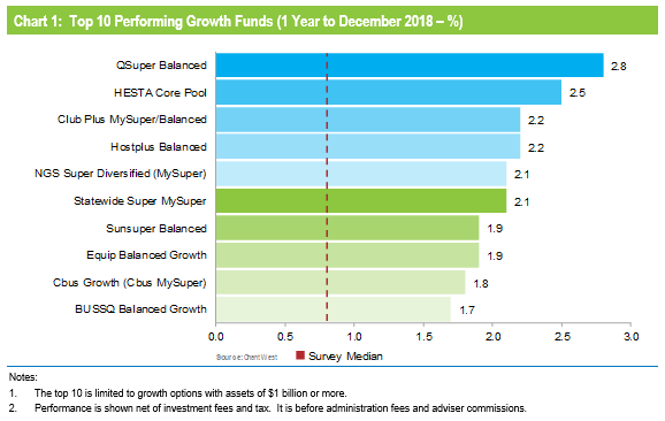
Table 1 compares the median performance for each fund category in Chant West’s Multi-Manager Survey, ranging from All Growth to Conservative. While 2018 was disappointing, over longer periods of 3, 5, 7, 10 and 15 years all risk categories have met their typical return objectives, which range from CPI + 2% for Conservative funds to CPI + 4.75% for All Growth.
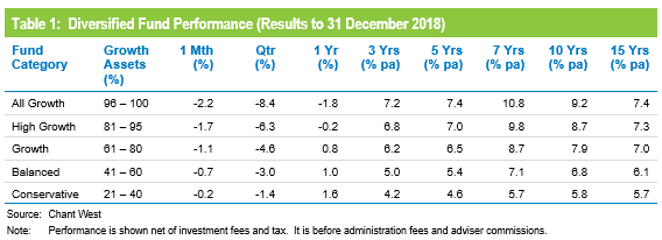
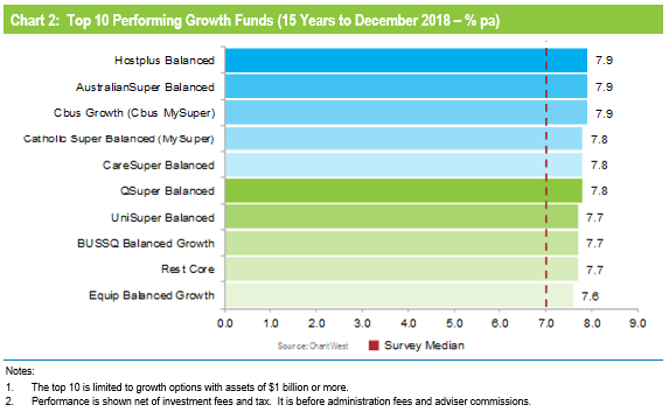
Chart 2 shows the top 10 performing growth options over 15 years. As has been the case for many years, the list is dominated by not-for-profit funds.
Lifecycle funds operating as designed
Mohankumar says: “While our Growth category is still where most people have their super, a meaningful number are now in so-called ‘lifecycle’ products. Most retail funds have adopted a lifecycle design for their MySuper defaults, where members are allocated to an age-based option that is progressively de-risked as that cohort gets older.
“It’s difficult to make direct comparisons of the performance of these age-based options with the traditional options that are based on a single risk category, and for that reason we report them separately. Table 2 shows the median performance for each of the retail age cohorts, together with their current median allocation to growth assets.”

While lifecycle is the most common MySuper default in the retail sector, most not-for-profit funds still use their traditional growth options for that default role. A few have gone down the lifecycle path, however, and while the general premise is the same the way it is implemented is different. Rather than allocating members to age-based cohorts as retail funds do, in the not-for-profit lifecycle model members ‘switch’ from one traditional risk category to another at particular ages. The diversified options that underlie these strategies are included in Table 1.
To help illustrate the early results of the retail lifecycle model, Table 2 includes a row for traditional MySuper Growth options – mainly, but not all, not-for-profit funds. Care should be taken when comparing the performance of the retail lifecycle cohorts with the median MySuper Growth option, however, as they are managed differently so their level of risk varies over time.
Aside from 2018, we have seen strong performance from growth assets in recent years so, as you would expect, the options that have higher allocations to growth assets have done best over three and five years. Up until the December 2018 quarter, younger members of retail lifecycle products – those born in the 1970s, 1980s and 1990s – had held their own compared with the median MySuper Growth fund, but had done so by taking on more share market risk. However, as a result of the recent share market falls, their performance now lags the MySuper Growth median over all periods shown in Table 2.
The older age cohorts (those born in the 1960s or earlier) are less exposed to share market risk so they have suffered less in the recent downturn than the younger ones and less than the median MySuper Growth fund. That is what these products are designed to do. Capital preservation is more important at those ages so, while they miss out on the full benefit in rising markets, older members in retail lifecycle options should be better protected in the event of a market downturn. That theory is working out in practice, as is clear from the one and three month results in Table 2. However, the performance of these older age cohorts still lagged the median MySuper growth fund over the year due to their minimal exposure to unlisted assets.
Funds still delivering on long-term targets
While 2018 was a disappointing year, Mohankumar encourages fund members to think long term and not panic. “Firstly, they should check that the investment option they’re in is suitable for them and, if so, remain patient and not get distracted by short-term noise. If you try to time the market by moving into a more conservative option after sharp share market falls, not only do you crystallise your losses but you also risk missing out on all or part of the subsequent rebound when markets recover.”
“So be aware of how your fund has performed over the past year, but remember that what’s more important is whether it’s achieving its long-term objectives. Most growth funds aim to beat inflation by 3% to 4% a year. We now have data going back 26½ years to July 1992, the start of compulsory super. Over that period, the annualised return is 8.1% and the annual CPI increase is 2.5%, giving a real return of 5.6% per annum – well above that 3% to 4% target.
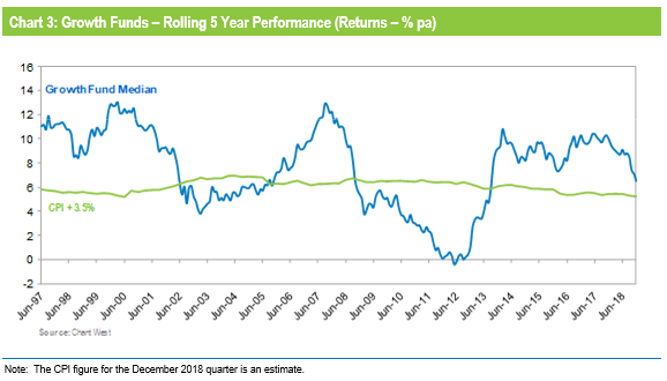
“That’s borne out visually in Chart 3, which compares the growth category median with the average return objective of CPI plus 3.5% per annum over rolling five year periods – that’s after investment fees and tax. Until 2009, the median fund outperformed the target most of the time. The GFC brought that to an abrupt halt, and the median dipped below the target line for several years. Now, with the GFC period out of the calculation, the five year return has been tracking well above the target line for the past five years.”
Returns are important but risk matters too
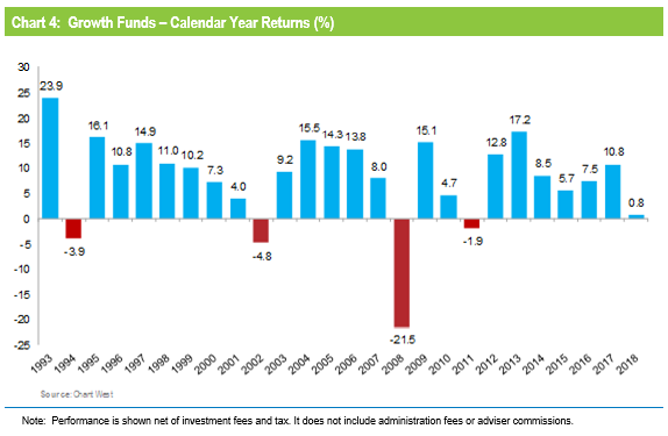
Mohankumar says: “Returns are important but so is risk, and most funds also set themselves a risk objective. Risk is normally expressed as the chance of a negative return, and typically a growth fund would aim to post no more than one negative return in five years on average. Chart 4 plots the year by year performance of the median growth fund over the full 26 calendar years since the introduction of compulsory super. The objective would be no more than five negative years in that time. As it turns out there have only been four, so the risk objective has been met as well as the performance objective.
“Over the longest period we can measure Australia’s major super funds have delivered on their promises to members, growing their wealth in real terms while protecting them from undue risk. That’s a great achievement, and it’s an important message their members should be aware of, too.”
The investments that drove the performance
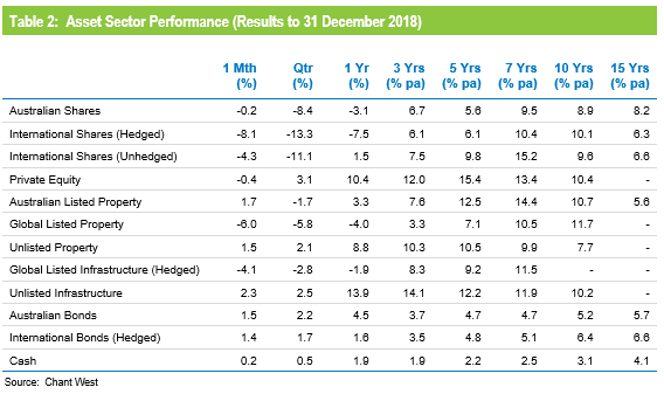
While there are differences between funds’ investment strategies, even within the same risk category, most of their performance is driven by what happens in the major investment markets.
Table 2 shows the performance of all the main asset sectors over different time periods to the end of December 2018. We have used market indices for all sectors other than private equity. For this sector, we have used the returns of a major fund in our survey that are representative of those markets.