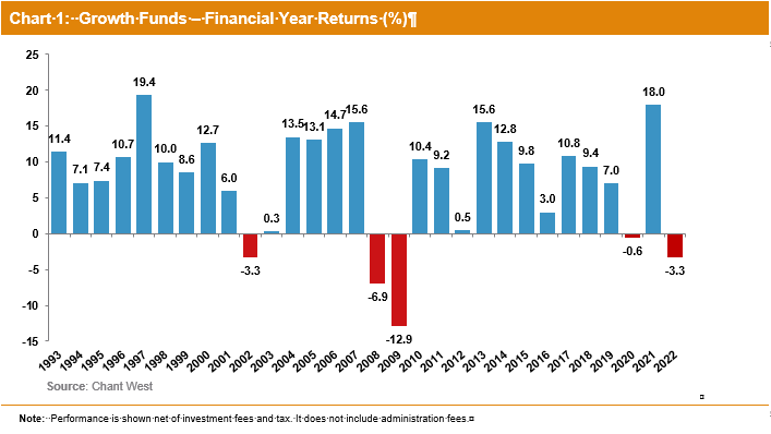
The 2022 financial year was a particularly challenging one for investment markets, yet super funds again proved their ability to limit the damage for their members. Despite heavy falls in all the traditional asset sectors – shares, listed property and bonds, both Australian and international – the median growth option (61 to 80% in growth assets) retreated just 3.3% over the year. That’s a very commendable result in the circumstances. While a negative return is naturally disappointing, we should not forget that this comes on the back of the staggering 18% result in FY21, which was the second highest return since the introduction of compulsory super in 1992.
Chant West Senior Investment Research Manager, Mano Mohankumar says that, unfortunately, the negative headlines we’ve seen in recent weeks about this year’s super fund performance have resulted in some funds’ call centres being inundated with queries. “A small step backwards this year is nothing to panic about. Members just need to filter out the ‘noise’ and look at the bigger picture. The negative return for FY22 represents only the fifth negative year in the full 30 years of compulsory super. The median growth fund is still 7.5% ahead of its high point at the end of January 2020 before the COVID crisis took hold. More importantly, funds continue to meet their long-term return objectives by a comfortable margin.
“When members read or hear about large share market losses, they should take a moment to realise that their super hasn’t fallen by anywhere near as much. Over FY22, Australian shares retreated 6.8%, while international shares were down 12.4% in hedged terms. It was the same story for listed property, with Australian and global REITs falling 11.2% and 10.5% respectively. That was bad enough, but what made the year even more challenging was that bonds didn’t play their usual cushioning role, with Australian bonds and international bonds falling 10.5% and 9.3%, respectively. Despite all this, the median growth fund was only down 3.3%. That’s mainly because most major super funds now invest far beyond these traditional asset sectors, with meaningful allocations to private equity, unlisted property and unlisted infrastructure which all delivered healthy returns for the year. Some funds were able to avoid the worst of the share market losses by taking active positions away from benchmark exposures. Another lever that paid off was maintaining a shorter duration bond exposure which is less sensitive to rises in yields.”
Chart 1 plots the year-by-year performance of the median growth fund over the 30 financial years since the introduction of compulsory super. It shows that the growth funds have done better than their typical long-term risk objective, which is one negative return in every five years, which translates to six negative years over the 30 financial years. In addition, growth funds have delivered on their typical long-term return objective which is to beat inflation by 3.5% p.a., which translates to about 6% p.a. Over this 30-year period, growth funds have returned 7.9% p.a. on average. That’s nearly 2% a year ahead of the objective, which is a great achievement over such an extended timeframe.
Other key content
- Diversified fund performance by risk category
- Long-term performance including rolling 10 year returns chart
- Top 10 performing growth funds over the 2021/22 financial year
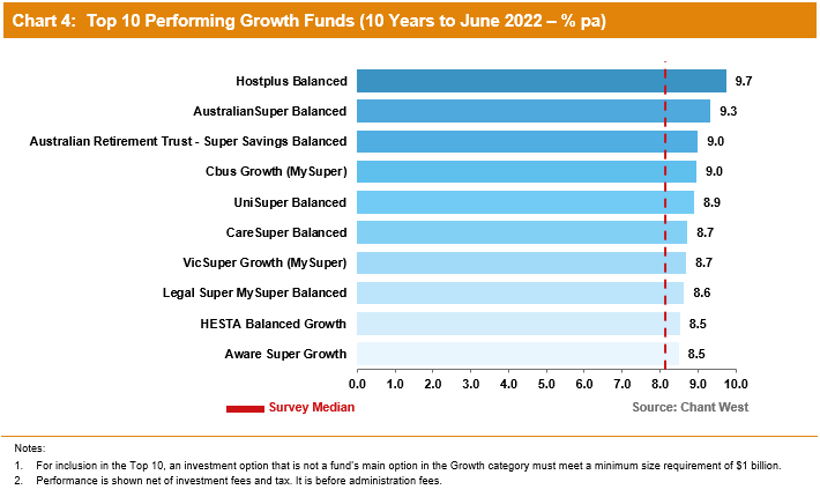
- Top 10 performing growth funds over 10 years
- Retail lifecycle product performance
Mohankumar says that when markets fall sharply, as they’ve done over the past six months, there’s a tendency for some people to panic and think about moving money into less risky investment options, or to cash, with a view to switching back later. “We caution members about the perils of attempting to time the market. Far more often than not, it results in a worse outcome in the long run than if you stay the course. Panicking only converts paper losses into real ones. Not only that, you risk missing out when markets rebound – as they will at some point. Even many members close to retirement can afford to take a long-term view. That’s because a lot of people most likely won’t take out all their super when they retire. A substantial amount is likely to stay in the super system in the pension phase, often for many years, which provides plenty of time for losses to be recovered.
“So we encourage everyone – younger and older – to remember that superannuation is indeed a long-term investment. Most members can afford to remain patient and, if you’re thinking about withdrawing money or switching to a less risky option, we strongly encourage you to seek financial advice before doing so.”
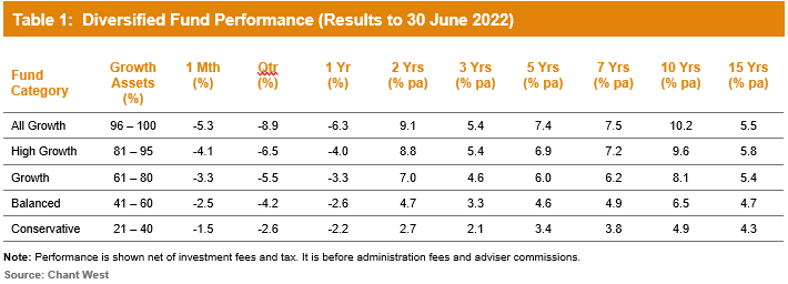
Table 1 compares the median performance for each of the traditional diversified risk categories in Chant West’s Multi-Manager Survey, ranging from All Growth to Conservative. All risk categories have generally met their typical long-term return objectives, which range from CPI + 1.75% for Conservative funds to CPI + 4.25% for All Growth.
With bonds experiencing significant falls over FY22, the lower risk categories fared little better than the higher risk categories. Indeed, the performance differential between our main Growth category and the Conservative category was only 1.1% over the financial year.
Funds still delivering on long-term targets
As mentioned earlier, over the 30 years since the introduction of compulsory super in July 1992, the median growth fund has delivered an annualised return of 7.9%, which is almost 2% p.a. ahead of the typical return objective. Even looking at the past 20 years, which includes four major share market downturns – the ‘tech wreck’ in 2002-2003, the GFC in 2007-2009, COVID-19 in 2020 and the first half of 2022 driven by high inflation and rising interest rates to combat it – super funds have returned 6.9% p.a., which is still comfortably ahead of the typical objective.
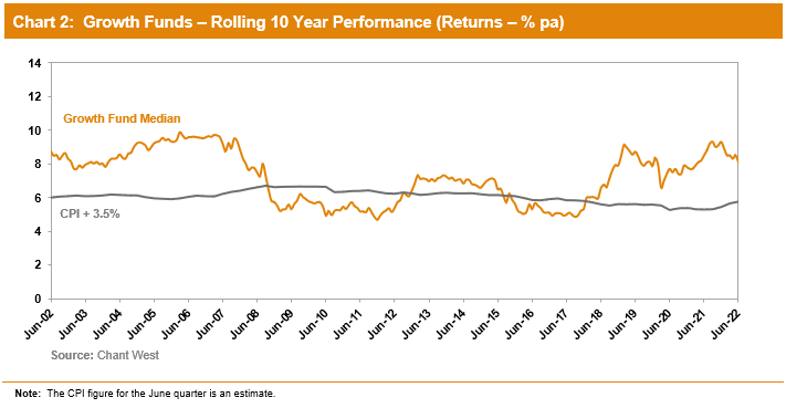
Chart 2 shows that, for the majority of the time, the median growth fund has exceeded its return objective over rolling 10-year periods, which is a commonly used timeframe consistent with the long-term focus of super. The exceptions are two periods between mid-2008 and late-2017, when it fell behind. This is because of the devastating impact of the 16-month GFC period (end-October 2007 to end-February 2009) during which growth funds lost about 26% on average.
Top 10 performers over one and ten years
Chart 3 shows the top 10 performing growth options over the 2022 financial year, together with the survey median.
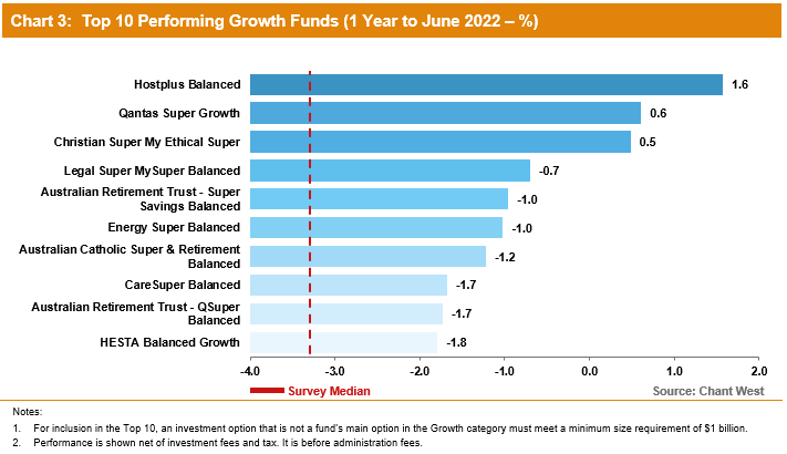
Chart 4 shows the top 10 performing growth options over 10 years to June 2022, together with the survey median.
Lifecycle products behaving as expected
Mohankumar says that while the Growth category is still where most people have their super invested, a meaningful number are now in so-called ‘lifecycle’ products. “Most retail funds have adopted a lifecycle design for their MySuper defaults where members are allocated to an age-based option that’s progressively de-risked as that cohort gets older.
“It’s difficult to make direct comparisons of the performance of these age-based options with the traditional options that are based on a single risk category, and for that reason we report them separately. Table 2 shows the median performance for each of the retail age cohorts, together with their current median allocation to growth assets. For comparison purposes it also includes a row for traditional MySuper Growth options – nearly all of which are not-for-profit funds. Care should be taken when comparing the performance of the retail lifecycle cohorts with the median MySuper Growth option, however, as they’re managed differently so their level of risk varies over time.”
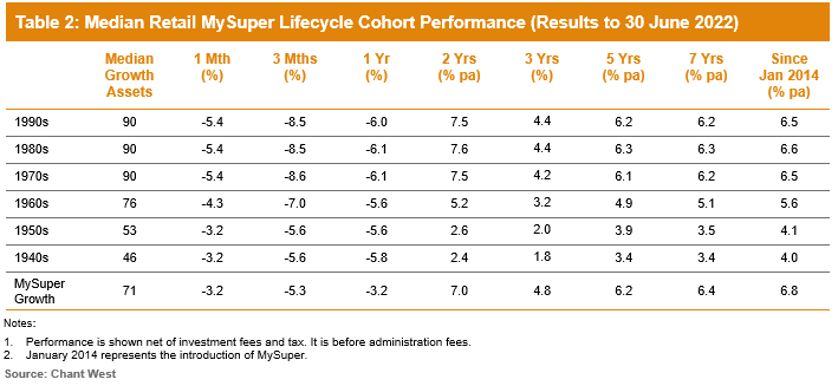
Despite the falls in global share markets so far in 2022, options that have higher allocations to growth assets have done better over most periods shown. Despite significant underperformance relative to the MySuper Growth median in FY22, younger members of retail lifecycle products – those born in the 1970s, 1980s and 1990s – have generally only slightly underperformed the MySuper Growth median over the three-year period and longer. However, it’s important to note that they take on significantly more share market risk. On average, these younger cohorts have at least 20% more invested in listed shares and listed real assets than the typical MySuper Growth option.
The 1960s cohort has generally underperformed the median MySuper Growth option. This is partly due to a lower allocation to growth assets up until recently, when lifecycle product providers revised their glide paths to delay the de-risking process until older ages. Another reason for this underperformance is a lower allocation to unlisted assets, which have performed well, and a higher allocation to traditional defensive asset sectors, such as bonds and cash, which have been the weakest performing sectors since the introduction of MySuper.
The oldest cohorts (those born in the 1950s or earlier) are relatively less exposed to growth assets so you would expect them to underperform the MySuper Growth median over longer periods. Capital preservation is more important at those ages, so while they miss out on the full benefit in rising markets, older members in retail lifecycle options are generally better protected in the event of market weakness. However, we note that even these older cohorts underperformed the MySuper Growth median over FY22 due to their higher allocation to traditional bonds and lower allocation to unlisted assets.
