The 2019 financial year was an unusual one for investment markets. All the main sectors produced positive results, there were no ‘must have’ assets that would guarantee above-average returns, and so fund performance was clustered far closer than usual. Yet some familiar names still found their way to the top of the year’s performance tables. What is the secret of their success?
FY 2019 was a year of two contrasting halves. The median growth fund had fallen 2.4% by the end of December, but then staged a sharp turnaround and raced up 9.5% in the next six months. The overall return for the year of 7.0% was surprisingly good. It was below the average of the previous nine, but nevertheless marked the 10th consecutive positive financial year.
The dark days of the GFC era have been left far behind. Growth funds are now up an astonishing 150% from their GFC low point a little over 10 years ago. Not only that, they are sitting 85% above their pre-GFC high. The recovery period is surely complete and we must anticipate more challenging times ahead, with the likelihood of some low or possibly negative years. Funds face the challenge of celebrating success while at the same time tempering their members’ expectations.
There’s no single secret to success …
If the year proved anything, it is that there is no ‘best way’ to manage investments. Investment markets provided no real pointers, with the dispersion of returns across the major sectors much narrower than we see most years. Shares and unlisted assets did well but didn’t reach the heights of some other recent years. Bonds had a strong year and a higher exposure to foreign currency would have also helped as the Australian dollar depreciated (from US$0.74 to US$0.70).
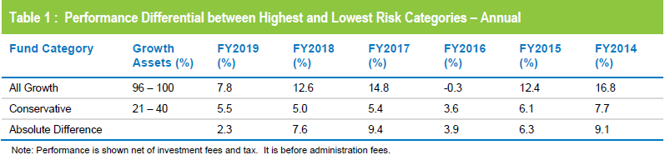
The only sector best avoided was cash. That narrow dispersion of most major asset sector returns led to a similarly narrow spread of returns between different risk categories. Table 1 shows that the difference in return for the year between our highest-risk All Growth category and our lowest-risk Conservative category was just 2.3%. This was dramatically less than the average 7.3% spread over the previous five years.
Returns in our growth category were also more tightly compressed than usual. For example, there was only 1.4% separating the top quartile from the bottom quartile.
This compares to a differential of 1.9% in 2017/18 and 2.4% in 2016/17. Even so, when one might have expected some lesser-known funds to star, the two equal top performers were QSuper and UniSuper. They each delivered an impressive 9.9%, well ahead of the third placed Media Super with 8.8%. One might be tempted to think that they had both happened upon a common secret to success, but that was not the case. Their investment strategies could hardly be more different, and that is reflected in their investment portfolios.
QSuper’s unique strategy includes a much lower allocation to listed shares than peers, offset by a significant allocation to long duration bonds. These bonds, the fund argues, carry sharemarket-like risk but are a better diversifier against sharemarket volatility than traditional bonds. This risk management approach, combined with a substantial allocation to unlisted property, infrastructure and private equity, aims to smooth out returns without any loss of performance.
UniSuper is also unusual among not-for-profit funds in that it has very little invested in unlisted assets. Instead, it prefers to gain the bulk of its exposure to property and infrastructure by taking large stakes in high quality listed entities. UniSuper believes that this listed market route enables it to be more opportunistic, allowing it to build a portfolio of higher quality property and infrastructure assets at attractive prices.
The success of these two funds is not a one-off. Both have made frequent appearances in our annual top 10 lists and they rank third (UniSuper) and fourth (QSuper) over the past decade. Joining them in the top five over 10 years are AustralianSuper, Hostplus and Cbus. It’s fair to say that all of these five funds have very distinct investment approaches, yet all of them have produced the consistent above-average performance that is required to rise to the top over the long term. This top 5 is based on taking into consideration only the main investment option for each fund in our Growth category.
… but scale is a common factor
These funds provide the proof to support our assertion that there is no single ‘best’ way to invest. Their success results from each following a strategy they believe in and executing that strategy skilfully and consistently. One thing they do all have in common, however, is scale. Our analysis suggests that scale is not a guarantee of top performance but it is most definitely an enabler.
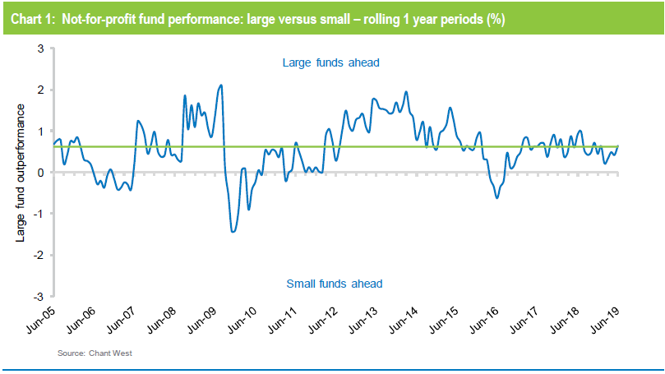
The connection between scale and performance is illustrated in Chart 1. The blue line represents the rolling 1 year median performance of 37 not-for-profit funds from our Growth category over 15 years ending June 2019. The funds are segregated into large (which we define as having assets of $15 billion or more) and small (less than $15 billion). Based on that, there are 14 large funds and 23 small funds and the chart shows those periods when one group or the other has been ahead. We have limited our analysis to not-for-profit funds because they are not constrained by commercial or liquidity constraints as retail funds are. Also they constitute a homogeneous group that allows us to focus on the ‘large vs. small effect’. Additionally, we have only taken the main investment option for each not-for-profit fund in our Growth category.
The chart shows that large funds have been ahead more often than not. In fact they outperformed in 85% of all those one year periods while small funds led just 15% of the time. Over the 15 years to June 2019, the median return for large funds is about 0.6% per annum ahead of the small fund median return (represented by the green line in the chart). Scale – and the opportunities and economies that flow from it – certainly appears to be a contributing factor to performance.
Retail lifecycle strategies doing their job but still lagging better-performing NFP Funds
The compression of returns in the 2019 financial year also meant that the median returns of the not-for-profit and retail sectors were closer than normal. Looking at traditional growth options, the not-for-profit median was 7% while the retail median was 6.9%.
However, comparing the two industry segments is more complex than in the past because of the prevalence of lifecycle strategies as the retail funds’ MySuper defaults. These lifecycle strategies cover the great majority of retail default members, and they are structured very differently from conventional growth options. They aim to maximise returns by adopting high growth asset allocations at younger ages and then switch more towards capital preservation by reducing portfolio risk at older ages, currently typically for members born in the 1960s or earlier.
To assess the performance of these lifecycle strategies we need to look at the performance of each age-based cohort. We can then compare that performance to the growth category median to see if the lifecycle model is doing the job it was designed to do.
In Table 2 we compare the median performance of each of the retail age cohorts over one, three and five years to June 2019 and over the entire MySuper era that began on 1 January 2014. We also show the median performance of the overall MySuper growth universe and of the retail funds’ traditional growth options. In each case we show the current median allocation to growth assets, so as to illustrate the relative risk characteristics of the different options.
The first thing to note is that members in the younger cohorts (those born in the 1970s and later) are exposed to considerably more sharemarket risk than their older counterparts and significantly more sharemarket risk than they would in the traditional growth options. We can see that, because growth assets have performed well in recent years, these younger members have been rewarded by way of higher returns. Over all the time periods shown, they have done better than the older cohorts and at least as well – in most cases considerably better – than they would have in a traditional retail fund growth option. However, against the MySuper Growth category which is dominated by not-for-profit funds, while the younger retail age cohorts have outperformed over one and three years, they have only held their own against the median since the introduction of MySuper despite taking on significantly more sharemarket risk. But they have underperformed the better performing not-for-profit funds.
Older members (those born in the 1960s or earlier) have still achieved respectable returns, but not as high as they would have in traditional growth options because they have had less exposure to rising growth markets, especially listed shares. That said, they are better positioned to withstand any downturn in share markets which, as the current bull run endures despite the prevailing economic climate, must be considered more and more likely.
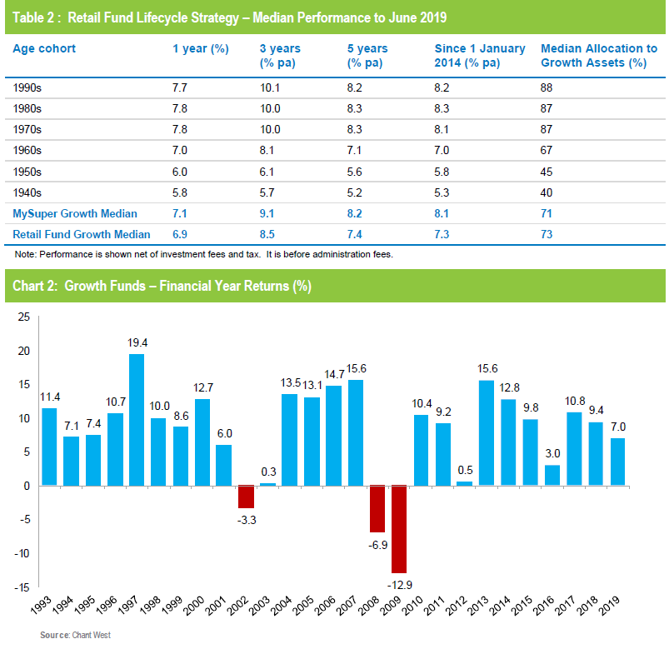
The GFC has led to more resilient portfolios
The past 10 years have been good to superannuation fund members, but we should remember that they partly represent the recovery from the shock that was the GFC. That is obvious from Chart 2, which plots the year by year performance of the median growth fund over the 27 financial years since the introduction of compulsory super. Over that time, growth funds have returned 8.3% per annum, which is 5.8% above the rate of inflation and well ahead of their typical performance target of a 3.5% real return. Over those 27 financial years there have been only three negative returns, again much better than the typical risk objective of one negative return in five years on average. Very clearly, therefore, funds have delivered on what they have promised their members in terms of risk and return.
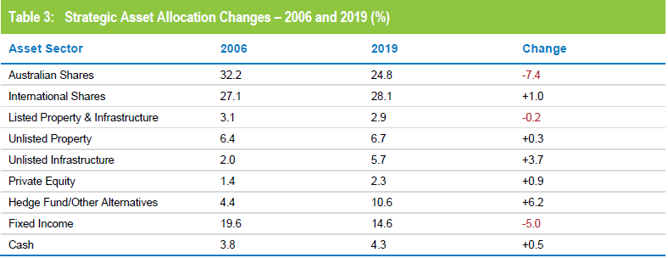
Two of those negative years were of course attributable to the GFC. No-one can predict where the next major shock is going to come from, but funds have taken steps over the ensuing decade to strengthen their portfolios and make them more resilient. Since the onset of the GFC in 2007 we have witnessed a significant shift away from volatile listed markets and a corresponding increase in unlisted and alternative assets. This is evident from Table 3, which shows the changes across our growth category between our 2006 and 2019 strategic asset allocation survey.
The most striking changes are:
The reduced exposure to Australian shares. The significant home bias that had an undue influence on portfolios back in 2006 has now been eliminated, and funds now have higher allocations to international shares than to the local market.
The reduction in traditional fixed income, i.e. bonds. This has been far more pronounced in the case of not-for-profit funds which, in recent years, have re-directed some of their defensive allocations into unlisted property, unlisted infrastructure and defensive alternatives.
The increased allocations to non-traditional asset sectors in the form of hedge funds and other alternatives. This is true across both not-for-profit and retail funds, although it is fair to say that the former segment led the way in this development.
It is to be hoped that this increased resilience will provide the desired downside protection when volatile listed markets turn negative. So far it has, as we saw in late 2018, but that was only a short and relatively minor event. The real test is yet to come.