Superannuation in Australia is fiercely competitive – far more so than the Government and some commentators give it credit for. One enduring rivalry is that between industry funds and retail funds, particularly regarding their investment performance. Unfortunately, while industry funds have delivered superior long-term investment performance, their lobby group, Industry Super Australia (ISA), exaggerates the quantum of this outperformance to the detriment of the industry and consumers.
Almost every time a performance survey is released it is quickly followed by some commentary from ISA extolling the superior returns of industry funds over what it calls 'bank-owned' and retail competitors.
Industry funds have been strong performers over many years, as Chant West has noted consistently. Indeed, industry funds have won our Best Fund: Investments award in each of the four years it has been contested. We admire the way they invest, and we have frequently pointed out that they have outperformed retail funds over the long term. It is perfectly reasonable for the industry fund movement to use this outperformance in their marketing, as long as the research they use to support their case makes fair comparisons and is transparent. Unfortunately, that is not the case with most of their releases.
For example, in a media release dated 20 April, ISA calls for policy makers to investigate what it calls the 'chronic underperformance of bank-owned super funds'. To call for an investigation is a serious matter. ISA links the banks' business models and for-profit culture to the underperformance of their wealth divisions' superannuation products, and goes so far as to question the appropriateness of banks' involvement in superannuation at all.
The reality is that retail funds have underperformed industry funds, but not nearly to the extent claimed by ISA. Table 1 is taken from ISA's 20 April media release, while Table 2 is adapted from Chant West's most recent performance release which covers a broader retail fund universe than just bank-owned funds. Both tables relate to periods ended 31 March 2016. Note that ISA has created its 'bank-owned funds' category (which includes 8 products) from the broader SuperRatings SR50 Balanced category.
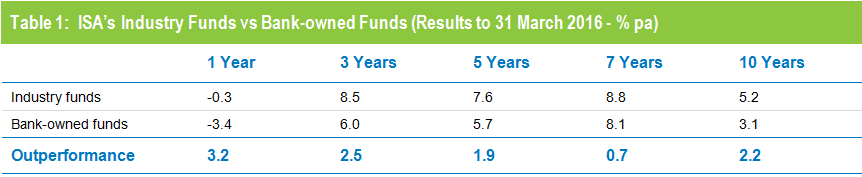
Source: Industry Super Australia
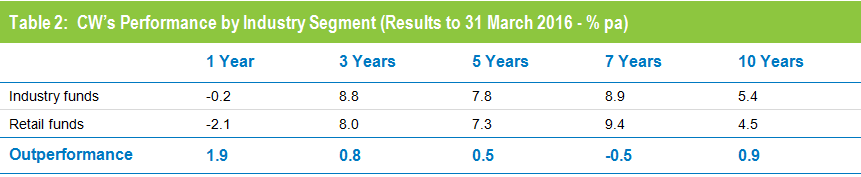
Source: Chant West
Based on: Performance is shown net of investment fees and tax. It is before administration fees and adviser commissions.
The differences between the two tables – which ostensibly measure the same thing – are too great to go unexplained. While there are slight differences in the asset allocation ranges for the risk categories – Chant West’s Growth category has 61 to 80% growth assets while the SuperRatings Balanced category quoted by ISA has 60 to 76% growth assets – these are not nearly enough to explain the different results.
Nor is the fact that Chant West's retail category contains funds that are not bank-owned. Our retail category comprises 13 bank-owned funds and 9 others. If we limit our analysis solely to the bank-owned funds, as in Table 3, the results are almost the same as in Table 2. In other words, bank-owned funds as a group have performed no better and no worse than other retail funds.
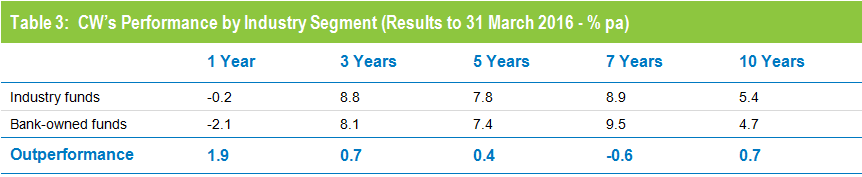
Source: Chant West
Legacy product fees distort the true picture
One key reason for the difference between ISA's numbers and ours is that the 8 'bank-owned funds' included in ISA's analysis include 6 legacy pre-FOFA products that, as well as investment fees, deduct administration fees and adviser commissions to arrive at their net returns. This produces relatively poor results for bank-owned funds and unfairly distorts any comparison with industry funds.
We also note that as commissions are no longer allowable in super, these products can not be sold and, therefore, should not be included in comparisons.
We estimate that, for the bank-owned funds included in ISA's analysis, those administration fees and commissions for the 6 legacy products amount to about 1% per annum on average. That goes a long way to explaining the differences between ISA's performance table and Chant West's.
As members of the Financial Services Council (FSC), bank-owned funds must adhere to FSC Standard No. 6. This requires them to report their performance net of 'all fees and tax', so their gross returns are reduced not only by investment fees and tax but also by administration fees and adviser commission, all at the maximum rate that many members do not pay. Industry funds, on the other hand, don't pay commission and typically charge the bulk of their administration fees as a dollar fee that sits outside of their reported investment return. Many retail funds also charge a dollar-based administration fee.
For purely technical reasons, therefore, retail funds are at a disadvantage whenever comparisons are based on reported returns. That is why, to ensure as fair a comparison as possible, Chant West has always shown performance net of investment fees and tax only. To do that, we require retail funds to provide us with returns that add back their administration fees and commissions. This adjustment is something we have been doing since 2003, and it is absolutely necessary to ensure an 'apples with apples' comparison.
In Table 4 we show the comparative results when we apply our methodology to the same 8 bank-owned funds included in ISA's media release. The table supports our argument that a large part of the difference between ISA's numbers and ours is to do with the treatment of fees in the pre-FOFA bank-owned products selected for comparison. These bank-owned funds are unfairly portrayed by ISA - to the tune of about 1% per annum on average – because no adjustment is made to their returns to account for the negative drag of administration fees and commissions.
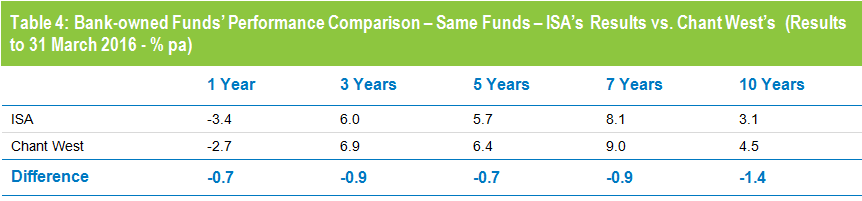
Source: Chant West
Put simply, Chant West's numbers purely reflect investment performance but ISA's numbers reflect something different. ISA's media release, its table and conclusions clearly overstate the case. They take a good story and then exaggerate it, which is unhelpful.
The true drivers of industry fund outperformance
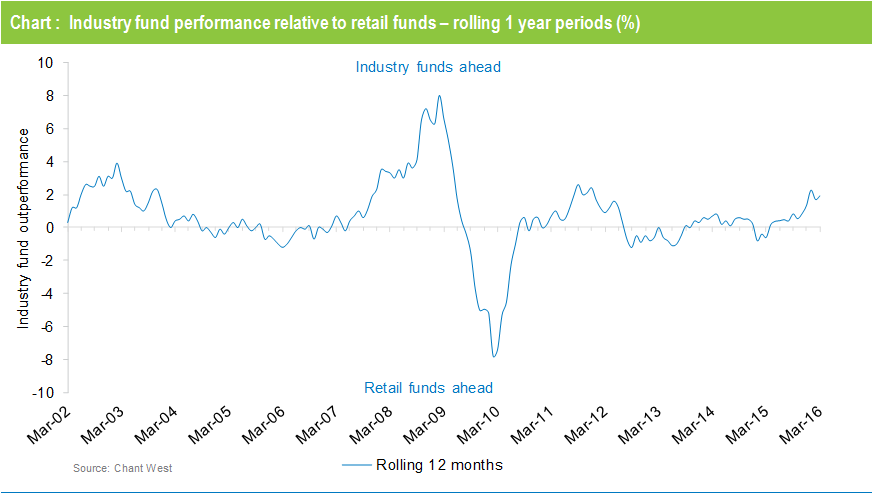
The outperformance of industry funds is real, but it has not been constant. The Chart below shows the rolling 1 year performance differentials between the industry fund and retail segment medians over the past 15 years to 31 March 2016. Overall, industry funds have been ahead 66% of the time, while retail funds have lead 29% of the time and the two segments have been level pegging the remaining 5% of the time. So industry funds have been ahead more often than not, but by no means all the time.
Our research shows that the explanation for these performance differentials, and the long-term outperformance of industry funds, has a lot to do with the structure and dynamics of the industry and their influence on asset allocation. It has little to do with the profit margins built into retail products or the governance models of industry funds. Industry funds have performed well because they have looked beyond traditional asset sectors, committing substantial amounts to alternative and unlisted assets. They have also benefited from being more active in managing their medium-term asset allocations. The fact is industry funds have proven to be astute and far-sighted investors.
Because of their default status for many workers, industry funds enjoy stable memberships and strong cash flows, mainly from compulsory SG contributions. Those compulsory contributions account for about 90% of their inflows, compared with just 65% for retail funds. With this degree of certainty, they have been able to pursue their 'best investment ideas'.
For their part, retail funds have always relied far more on discretionary contributions, which tend to dry up during times of uncertainty in investment markets. Also, their members are far more likely to have financial advisers who influence their decisions, and to be more engaged generally with their super. As a result, they are more likely to switch between funds, or between investment options within their existing fund.
All of this means that the asset base of retail funds is far less 'sticky'. This in turn influences how they invest, because they need to pay far more attention to liquidity than do industry funds. So, for example, while industry funds have long been happy to invest in unlisted property and infrastructure, retail funds have opted to approach those assets via listed securities that they can sell at short notice if necessary. Similarly, while industry funds have built up significant holdings in private equity and illiquid hedge funds, retail funds have opted for more liquid exposures in alternative assets.
These differences go a long way to explaining the variations in performance between the two segments at different times.
Let the true numbers speak for themselves
To sum up, ISA has exaggerated the outperformance of industry funds. Industry funds are winning the long-term game on their own merits, and they don't need the inflated claims of ISA to prove their point. They can afford to let the true numbers speak for themselves. The constant over-stating of the case by ISA does a disservice to industry funds, to our industry and to all fund members.
