Super funds have continued their bright start to the new financial year with the median growth fund (61 to 80% in growth assets) returning 1.7% in August. This brings the return over the first two months of FY20/21 to 2.7%.
Chant West senior investment research manager Mano Mohankumar says: “The median growth fund lost 12% over February and March but since then has returned an impressive 9.5% on the back of the surprisingly sharp share market rally. Over the first half of September we’ve seen signs of that rally wavering along with increased volatility, which doesn’t come as a surprise given the level of economic and political uncertainty. The global economy is in recession but we don’t know what pattern the downturn and eventual recovery will take. Trade tensions between the US and China continue to escalate and of course we have the US election less than seven weeks away. Meanwhile in Europe the final Brexit arrangements are still up in the air. Despite these concerns, super fund members should take comfort in that fact that their funds generally run well-diversified portfolios that have proved to be resilient in the face of external shocks.
“Listed share markets, which are the main drivers of growth fund performance, had a terrific month in August. Australian shares returned 3%, while international shares surged 5.8% in hedged terms. However, the appreciation of the Australian dollar (up from US$0.72 to US$0.74) reduced that gain to 2.9% unhedged terms.
“In the US, share markets hit a new all-time high despite the US-China trade tensions worsening. Markets were driven instead by optimism about the development of a COVID-19 vaccine, the Federal Reserve’s ongoing commitment to providing support measures and the release of economic data that showed some modest signs of recovery. In the euro zone, economic data was mixed and there was ongoing nervousness around increasing COVID-19 infections. The UK reported an uplift in economic activity which was helped by ongoing policy support. In Japan, we saw the unexpected resignation of Prime Minister Shinzo Abe due to health issues, while the earnings reporting season was better than expected.
“Back at home, all eyes have been on Victoria’s second wave of infections and the State government’s lockdown measures which, while controversial, have resulted in case numbers heading in the right direction. The Federal government continues to provide massive financial support, with the JobKeeper and JobSeeker programs extended to help the economy get back on a path to recovery.”
Table 1 compares the median performance for each of the traditional diversified risk categories in Chant West’s Multi-Manager Survey, ranging from All Growth to Conservative. Over 3, 5, 7, 10 and 15 years, all risk categories have met their typical long-term return objectives, which range from CPI + 2% for Conservative funds to CPI + 4.75% for All Growth.
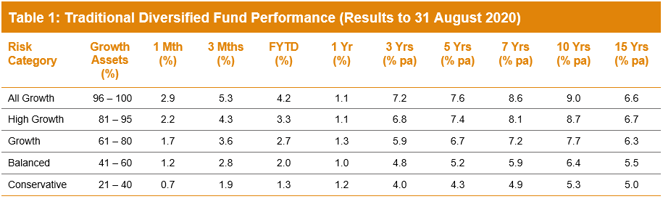
Note: Performance is shown net of investment fees and tax. It is before administration fees and adviser commissions.
Source: Chant West
Lifecycle products behaving as expected
Mohankumar says: “While our Growth category is still where most people have their super invested, a meaningful number are now in so-called ‘lifecycle’ products. Most retail funds have adopted a lifecycle design for their MySuper defaults, where members are allocated to an age-based option that is progressively de-risked as that cohort gets older.”
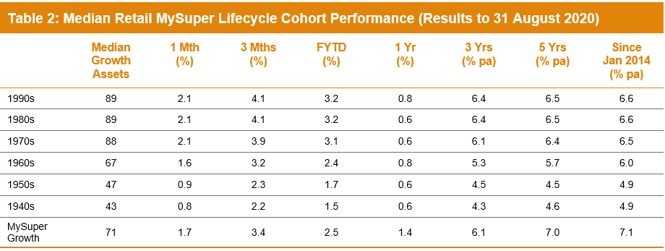
It’s difficult to make direct comparisons of the performance of these age-based options with the traditional options that are based on a single risk category, and for that reason we report them separately. Table 2 shows the median performance for each of the retail age cohorts, together with their current median allocation to growth assets. It also includes a row for traditional MySuper Growth options for comparison – nearly all of which are not-for-profit funds. Care should be taken when comparing the performance of the retail lifecycle cohorts with the median MySuper Growth option, however, as they are managed differently so their level of risk varies over time.
Notes:
1. Performance is shown net of investment fees and tax. It is before administration fees and adviser commissions.
2. January 2014 represents the introduction of MySuper.
Source: Chant West
Despite positive returns from April through to August, the sharp setback in February and March has resulted in those options that have higher allocations to growth assets generally faring worse over the past year. Over longer periods those higher-risk options, which cover the younger cohorts born in the 1960s or later, have generally performed better. However, despite taking on more share market risk, these younger cohorts haven’t performed as well as the median MySuper Growth option, either over five years or since the introduction of MySuper.
The reason these younger cohorts in retail lifecycle funds have underperformed the MySuper Growth option over those longer periods is that these funds, while generally well-diversified, still don’t have the same level of diversification as many of the not-for-profit funds. This is mainly due to the not-for-profit funds’ higher allocations to unlisted assets (unlisted property, unlisted infrastructure and private equity) – about 21% on average. This compares with the retail lifecycle fund average of 5% for these younger cohorts, although there are a few that have 10-14% unlisted asset allocations. These assets have been proven to add value over the long term, not just for their diversification qualities but also because they generate an illiquidity premium in their returns relative to listed markets. We should note that short-term performance comparisons are somewhat complicated by the fact that some funds have devalued their unlisted assets more aggressively than others over the course of the COVID crisis.
The older cohorts (those born in the 1950s or earlier) are relatively less exposed to growth assets so you would expect them to underperform the MySuper Growth median over longer periods. Capital preservation is more important at those ages so, while they miss out on the full benefit in rising markets, older members in retail lifecycle options are better protected in the event of a market downturn.
Long-term performance remains above target
MySuper products have only been operating for six and a half years, so when considering performance it is important to remember that super is a much longer-term proposition. Since the introduction of compulsory super in 1992, the median growth fund has returned 8.1% per annum. The annual CPI increase over the same period is 2.3%, giving a real return of 5.8% per annum – well above the typical 3.5% target. Even looking at the past 20 years, which now includes three share major market downturns – the ‘tech wreck’ in 2001–2003, the GFC in 2007–2009 and now COVID-19 – the median growth fund has returned 6.4% per annum, which is still comfortably ahead of the typical return objective.
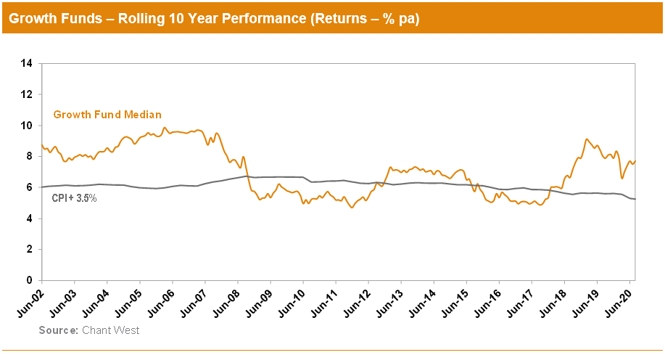
For most of the compulsory super era, funds typically set their return objectives over rolling five-year periods. However, over recent years we’ve seen more and more funds move to re-set their objectives over rolling ten-year periods, which is more consistent with a longer-term focus. We believe it is appropriate for us now to use rolling ten-year performance data when we plot the performance of the median fund versus the typical return objective. The chart below shows that, for the majority of the time, the median growth fund has exceeded its return objective. The exceptions are two periods between mid-2008 and late-2017, when it fell behind. This is because of the devastating impact of the 16-month GFC period (end-October 2007 to end-February 2009) during which growth funds lost about 26% on average. That impact persists far longer in a rolling 10-year chart than it does in our previous rolling 5-year chart.
Note: The CPI figures for July and August 2020 are estimates.
International share market returns in this media release are sourced from MSCI. This data is the property of MSCI. No use or distribution without written consent. Data provided “as is” without any warranties. MSCI assumes no liability for or in connection with the data. Product is not sponsored, endorsed, sold or promoted by MSCI. Please see complete MSCI disclaimer.
