Against the expectations of many experts, super funds are closing in on a bumper result for the 2019 calendar year. After another strong month in November there is a strong likelihood of an annual return well into the double digits. The median growth fund (61 to 80% in growth assets) was up 1.9% for the month, pushing the return for the first eleven months of the year to 14.4%. Markets have been relatively flat so far in December so we estimate that, with two weeks to go, the calendar year return is still sitting close to 14.5% – a very impressive result.
In November, Australian shares were up 3.2%. International shares were also up 3.2% in hedged terms but a depreciation of the Australian dollar (down from US$0.69 to US$0.68) lifted that even higher to 4.7% in unhedged terms. However, listed property was mixed with Australian REITs gaining 2.3% but global REITs down 0.9%.
Chant West senior investment research manager Mano Mohankumar says: “It has been a tremendous year for super funds with the median growth fund return on pace to finish in the mid teens. That’s a much better result than what we could have expected at the start of the year and a major turnaround from a year ago when growth funds lost 4.6% in the December 2018 quarter and investor sentiment was decidedly negative. This year’s return will also be the 10th positive calendar year in the past eleven, which in itself is quite an achievement.
“Fund members will have every reason to be delighted when they see their end-December balances, but we do caution them not to get carried away. They need to understand that the strong returns they’ve experienced over the past decade aren’t sustainable over the long term, and they should expect more modest returns ahead. With record low interest rates and low inflation, asset prices have risen to levels that are at or approaching full valuation. There’s ongoing concern about the slowing of global economic growth and what central banks have left in their armouries to counter it. The other major uncertainty, of course, is trade relations between the US and China. While there has been some limited progress in the past month, the underlying tensions remain unresolved and could quite easily resurface. And while Boris Johnson’s comfortable victory in last week’s UK election means that Brexit will now occur, there’s still uncertainty about what economic consequences that will have.
“Whatever the outlook, Australians should take comfort that their superannuation is generally invested in well-diversified portfolios with investments spread across a wide range of asset sectors. The typical growth fund has more resilience built in than it did a decade ago, so it is better positioned to weather a period of investment market weakness if that eventuates.”
Table 1 compares the median performance for each of the traditional diversified risk categories in Chant West’s Multi-Manager Survey, ranging from All Growth to Conservative. All risk categories are ahead of their long-term return objectives over 1, 3, 5, 7, 10 and 15 years. Those objectives range from inflation plus 2% for the Conservative category to inflation plus 4.75% for the All Growth category.
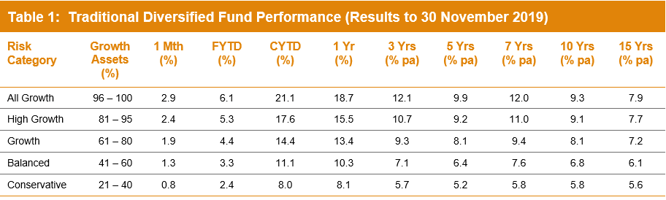
Note: Performance is shown net of investment fees and tax. It is before administration fees and adviser commissions.
Source: Chant West
Lifecycle products behaving as expected
Mohankumar says, “While our Growth category is still where most people have their super invested, a meaningful number are now in so-called ‘lifecycle’ products. Most retail funds have adopted a lifecycle design for their MySuper defaults, where members are allocated to an age-based option that is progressively de-risked as that cohort gets older.”
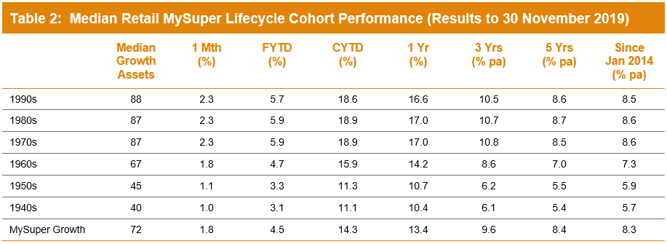
It’s difficult to make direct comparisons of the performance of these age-based options with the traditional options that are based on a single risk category, and for that reason we report them separately. Table 2 shows the median performance for each of the retail age cohorts, together with their current median allocation to growth assets.
Notes:
1. Performance is shown net of investment fees and tax. It is before administration fees and adviser commissions.
2. January 2014 represents the introduction of MySuper.
Source: Chant West
While lifecycle is the most common MySuper default in the retail sector, most not-for-profit funds still use their traditional growth options as their default investment option. A few not-for-profit funds have gone down the lifecycle path, however, and while the general premise is the same the way it is implemented is different. Rather than allocating members to age-based cohorts as retail funds do, in the not-for-profit lifecycle model members typically ‘switch’ from one traditional risk category to another at particular ages. The diversified options that underlie these strategies are included in Table 1.
To help illustrate the early results of the retail lifecycle model, Table 2 includes a row for traditional MySuper Growth options – mainly, but not all, not-for-profit funds. Care should be taken when comparing the performance of the retail lifecycle cohorts with the median MySuper Growth option, however, as they are managed differently so their level of risk varies over time.
We have mostly seen strong performance from growth assets in recent years so, as we would expect, the options that have higher allocations to growth assets have generally done best. Younger members of retail lifecycle products – those born in the 1970s, 1980s and 1990s – have outperformed the MySuper Growth median over all periods shown. However, they have done so by taking on more share market risk.
The older age cohorts (those born in the 1960s or earlier) are relatively less exposed to share market risk. Capital preservation is more important at those ages so, while they miss out on the full benefit in rising markets, older members in retail lifecycle options should be better protected in the event of a market downturn.
Long-term performance remains above target
MySuper products have only been operating for less than six years, so when considering performance it is important to remember that super is a much longer-term proposition. The chart below compares the performance since July 1992 – the start of compulsory superannuation – of the traditional Growth category median with the typical return objective for that category (CPI plus 3.5% per annum after investment fees and tax over rolling five-year periods). The healthy returns since the end of the GFC in early 2009 have seen the longer-term performance tracking well above that CPI plus 3.5% target for the past six years.
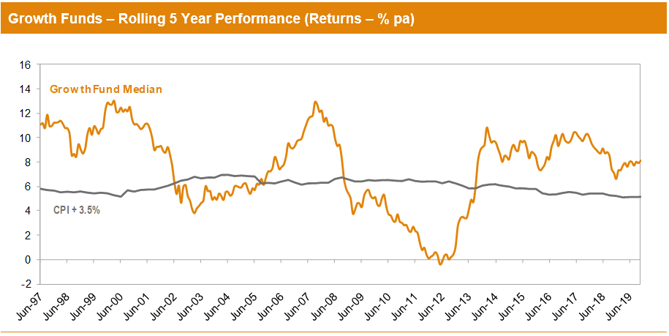
Note: The CPI figures for October and November 2019 estimates.
Source: Chant West
