With less than two weeks of the financial year remaining, super funds are on the brink of a record-breaking 10th consecutive positive return for members. While the median growth fund (61 to 80% in growth assets) was down 0.7% in May, the return over the first 11 months of the financial year was 4.6% and June has been positive so far.
Share markets, which are the main drivers of growth fund performance, were mixed in May. Australian shares gained 1.7% while hedged international shares fell 5.9%. The depreciation of the Australian dollar over the month (down from US$0.70 to US$0.69) trimmed the loss to 4.4% in unhedged terms. Listed property was similarly mixed, with Australian REITs up 2.3% but international REITs down 0.3%.
Chant West senior investment research manager Mano Mohankumar says: "Listed markets are up so far in June, and we estimate that the median return for the financial year to date is currently sitting at about 6.5%. That's a much brighter picture than we might have expected at the halfway point of the year, when growth funds were down 2.4% for the six months to December.
"This year's return won't reach the levels we've seen in some recent years but it's important to keep things in perspective. Growth funds have had a tremendous run averaging about 9% per annum over the past nine years, but that's really not sustainable and should be seen as the exception rather than the rule. Their typical long-term objective is to beat inflation by 3.5%, which would currently translate to a return of 5% to 5.5%, so a return of about 6.5% should be considered a good result.
"While the second half of the financial year has been quite strong, we caution members not to get carried away because the economic background is still dogged by uncertainties. In May, we saw the re-emergence of trade tensions between the US and China. The UK is in the process of transitioning to a new Prime Minister, adding to the uncertainty over Brexit, and all the while the pace of global economic growth continues to linger.
"Back at home, the RBA cut its cash rate earlier this month by 0.25% to a new record low of 1.25% to provide support to our lacklustre economy. That's its first move since August 2016, and there remains the possibility of a further reduction later this year."
Table 1 compares the median performance for each of the traditional diversified risk categories in Chant West's Multi-Manager Survey, ranging from All Growth to Conservative. All risk categories are now ahead of their long-term return objectives over 1, 3, 5, 7, 10 and 15 years.
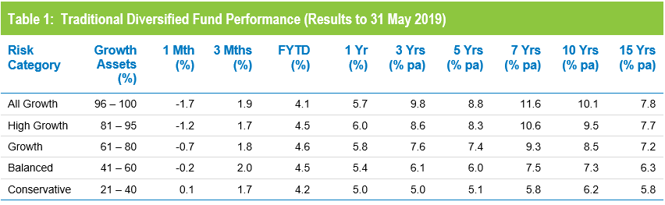
Source: Chant West
Note: Performance is shown net of investment fees and tax. It is before administration fees and adviser commissions.
Lifecycle products behaving as expected
Mohankumar says, "While our Growth category is still where most people have their super, a meaningful number are now in so-called 'lifecycle' products. Most retail funds have adopted a lifecycle design for their MySuper defaults, where members are allocated to an age-based option that is progressively de-risked as that cohort gets older.
"It's difficult to make direct comparisons of the performance of these age-based options with the traditional options that are based on a single risk category, and for that reason we report them separately. Table 2 shows the median performance for each of the retail age cohorts, together with their current median allocation to growth assets."
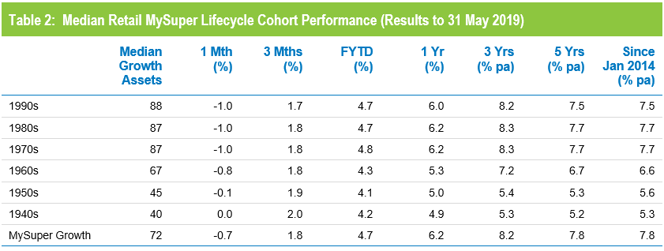
Source: Chant West
Note: Performance is shown net of investment fees and tax. It is before administration fees and adviser commissions.
While lifecycle is the most common MySuper default in the retail sector, most not-for-profit funds still use their traditional growth options for that default role. A few have gone down the lifecycle path, however, and while the general premise is the same the way it is implemented is different. Rather than allocating members to age-based cohorts as retail funds do, in the not-for-profit lifecycle model members typically 'switch' from one traditional risk category to another at particular ages. The diversified options that underlie these strategies are included in Table 1.
To help illustrate the early results of the retail lifecycle model, Table 2 includes a row for traditional MySuper Growth options – mainly, but not all, not-for-profit funds. Care should be taken when comparing the performance of the retail lifecycle cohorts with the median MySuper Growth option, however, as they are managed differently so their level of risk varies over time.
Aside from the 2018 calendar year, we have seen strong performance from growth assets in recent years so, as you would expect, the options that have higher allocations to growth assets have generally done best. Younger members of retail lifecycle products – those born in the 1970s, 1980s and 1990s – have generally held their own compared with the median MySuper Growth fund. However, they have done so by taking on more share market risk. .
The older age cohorts (those born in the 1960s or earlier) are less exposed to share market risk. Capital preservation is more important at those ages so, while they miss out on the full benefit in rising markets, older members in retail lifecycle options should be better protected in the event of a market downturn.
Long-term performance remains above target
MySuper products have only been operating for just over five years, so when considering performance it is important to remember that super is a much longer-term proposition. The Chart below compares the performance since July 1992 – the start of compulsory superannuation – of the traditional Growth category median with the typical return objective for that category (CPI plus 3.5% per annum after investment fees and tax over rolling five-year periods). Notwithstanding the sharp downturn at the end of 2018, the healthy returns since the end of the GFC in early 2009 have seen the longer-term performance tracking well above that CPI plus 3.5% target for the past five years.
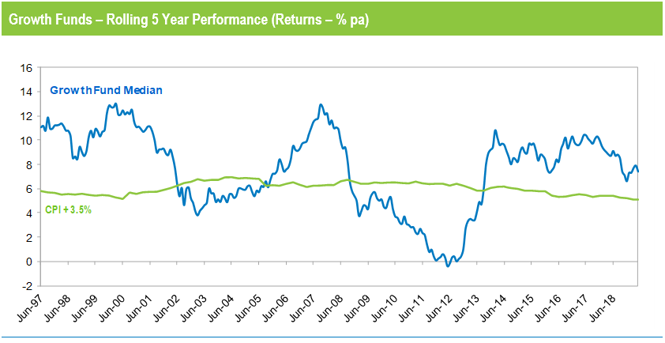
Source: Chant West
Note: The CPI figures for April and May are estimates.
