Super funds posted a solid return over the September quarter, with the median growth fund (61 to 80% in growth assets) up 2%. That was despite a slight retreat in September, which saw the first negative monthly result since March.
Chant West senior investment research manager Mano Mohankumar says: “Share markets wobbled a little in September after rallying strongly for the previous five months. But again we saw the value of diversification come to the fore – just as we did during the market crisis in February and March. Australian and hedged international shares were down 3.6% and 2.9% respectively for the month, but by having exposure to a wide range of growth and defensive asset sectors the median growth fund was able to contain the loss to just 0.6%.
“The positive return over the September quarter was driven mainly by international shares, which returned an impressive 6.9% in hedged terms. However, the appreciation of the Australian dollar (up from US$0.69 to US$0.72) reduced that gain to 3.8% in unhedged terms. While global shares were up overall, there was a lot of divergence between regions with the US and Asian markets forging ahead of Europe and the UK. Australian shares were flat, with a return of -0.1% over the period.
“After a shaky September, share markets have regained momentum in October and we estimate that the median growth fund is up 2.5% for the month to date and up an impressive 11.5% since the end of March. So growth funds have now erased most of the 12% loss experienced back in February and March. That’s despite the uncertain global economic and political backdrop. The global economy is in recession but we don’t know what pattern the downturn and eventual recovery will take. Trade tensions with China keep simmering in the background but, more immediately, all eyes will be on the upcoming US election which is only two weeks away.
“Back at home, the focus remains on events in Victoria and the State government’s lockdown measures which, while controversial, have resulted in case numbers heading lower. Earlier this month, the Federal government presented its delayed budget. While it is scaling back its JobSeeker and JobKeeper payments, the government will continue to provide financial support to help the economy get back on a path to recovery. Part of that is the introduction of a new JobMaker program that provides incentives for businesses to hire younger employees.”
Table 1 compares the median performance for each of the traditional diversified risk categories in Chant West’s Multi-Manager Survey, ranging from All Growth to Conservative. Over 3, 5, 7, 10 and 15 years, all risk categories have met their typical long-term return objectives, which range from CPI + 2% for Conservative funds to CPI + 4.5% for All Growth.
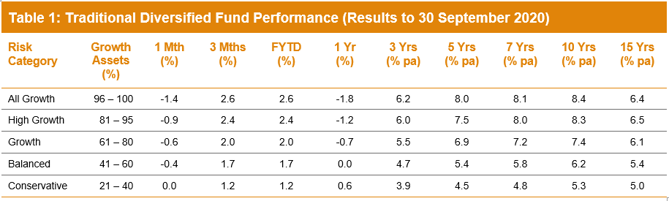
Note: Performance is shown net of investment fees and tax. It is before administration fees and adviser commissions.
Source: Chant West
Lifecycle products behaving as expected
Mohankumar says: “While our Growth category is still where most people have their super invested, a meaningful number are now in so-called ‘lifecycle’ products. Most retail funds have adopted a lifecycle design for their MySuper defaults, where members are allocated to an age-based option that is progressively de-risked as that cohort gets older.”
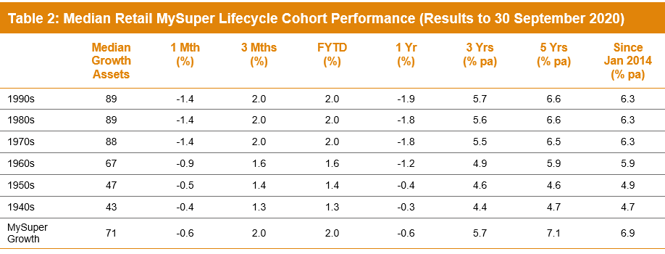
It’s difficult to make direct comparisons of the performance of these age-based options with the traditional options that are based on a single risk category, and for that reason we report them separately. Table 2 shows the median performance for each of the retail age cohorts, together with their current median allocation to growth assets. It also includes a row for traditional MySuper Growth options for comparison – nearly all of which are not-for-profit funds. Care should be taken when comparing the performance of the retail lifecycle cohorts with the median MySuper Growth option, however, as they are managed differently so their level of risk varies over time.
Notes:
1. Performance is shown net of investment fees and tax. It is before administration fees and adviser commissions.
2. January 2014 represents the introduction of MySuper.
Source: Chant West
Despite the strong recovery since April, the initial COVID-related setback in February and March is still being reflected in the short-term numbers, so those options that have higher allocations to growth assets have performed relatively poorly over the past year. Over longer periods those higher-risk options, which cover the younger cohorts born in the 1960s or later, have generally performed better. However, despite taking on more share market risk, these younger cohorts haven’t performed as well as the median MySuper Growth option, either over five years or since the introduction of MySuper.
The reason these younger cohorts in retail lifecycle funds have underperformed the MySuper Growth option over those longer periods is that these funds, while generally well-diversified, still don’t have the same level of diversification as many of the not-for-profit funds. This is mainly due to the not-for-profit funds’ higher allocations to unlisted assets (unlisted property, unlisted infrastructure and private equity) – about 21% on average. This compares with the retail lifecycle fund average of 5% for these younger cohorts, although there are a few that have 10-14% unlisted asset allocations. These assets have been proven to add value over the long term, not just for their diversification qualities but also because they generate an illiquidity premium in their returns relative to listed markets. We should note that short-term performance comparisons are somewhat complicated by the fact that some funds have devalued their unlisted assets more aggressively than others over the course of the COVID crisis.
The older cohorts (those born in the 1950s or earlier) are relatively less exposed to growth assets so you would expect them to underperform the MySuper Growth median over longer periods. Capital preservation is more important at those ages so, while they miss out on the full benefit in rising markets, older members in retail lifecycle options are better protected in the event of a market downturn.
Long-term performance remains above target
MySuper products have only been operating for less than seven years, so when considering performance it is important to remember that super is a much longer-term proposition. Since the introduction of compulsory super in 1992, the median growth fund has returned 8% per annum. The annual CPI increase over the same period is 2.3%, giving a real return of 5.7% per annum – well above the typical 3.5% target. Even looking at the past 20 years, which now includes three share major market downturns – the ‘tech wreck’ in 2001–2003, the GFC in 2007–2009 and now COVID-19 – the median growth fund has returned 6.3% per annum, which is still ahead of the typical return objective.
The chart below shows that, for the majority of the time, the median growth fund has exceeded its return objective over rolling ten-year periods, which is a commonly-used timeframe consistent with the long-term focus of super. The exceptions are two periods between mid-2008 and late-2017, when it fell behind. This is because of the devastating impact of the 16-month GFC period (end-October 2007 to end-February 2009) during which growth funds lost about 26% on average.
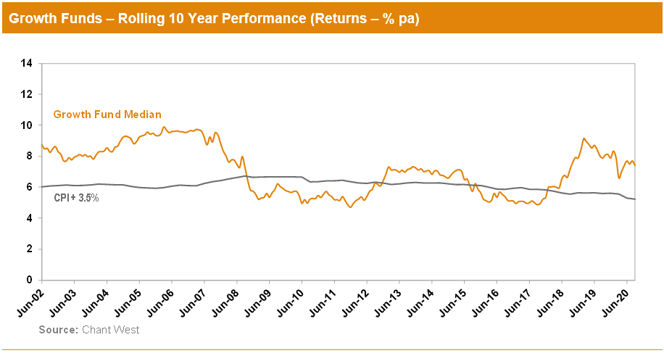
Note: The CPI figure for the September quarter is an estimate.
International share market returns in this media release are sourced from MSCI. This data is the property of MSCI. No use or distribution without written consent. Data provided “as is” without any warranties. MSCI assumes no liability for or in connection with the data. Product is not sponsored, endorsed, sold or promoted by MSCI. Please see complete MSCI disclaimer.
