Chant West and Epic Retirement announce outcome of 2027 Epic Retirement Tick assessment
01/Oct/2026Chant West and the Epic Retirement Institute today announced the outcome of the 2027 Epic Retirement Tick assessment.
View more
The FY26 super sector performance numbers are in, and for the fourth consecutive year, super funds have delivered strong returns. But what should your advice clients be making of this, Mano Mohankumar explains.
Four consecutive years and a 44% cumulative return. What should clients make of it?
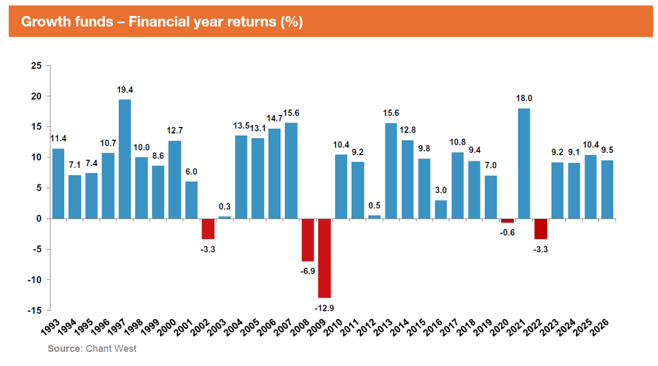
The FY26 super sector performance numbers are in, and for the fourth consecutive year, super funds have delivered strong returns. The median growth fund (61 to 80% in growth assets) returned 9.5% for FY26, following returns of 9.2% in FY23, 9.1% in FY24 and 10.4% in FY25.
That four-year run adds up to a cumulative 44% return. For clients who stayed invested through periods of volatility, it has been a rewarding period.
But as our Head of Superannuation Investment, Mano Mohankumar, noted in our recent webinar, this level of return should not be treated as the new normal. The long-term return objective for growth funds is to beat inflation by 3.5% p.a., which translates to roughly 6% p.a. Four consecutive years above 9% is an outcome to be pleased about, not an expectation to set.
What drove the result?
International shares were again the primary driver, returning 25.5% in hedged terms over FY26. The continued enthusiasm for AI-related stocks and robust corporate earnings supported the result. Even in unhedged terms, the return was an impressive 17%, despite the Australian dollar appreciating against most major currencies.
International shares carry the highest weighting within a typical growth fund at around 31% on average, which made the asset class particularly impactful on overall returns. By comparison, Australian shares, with an average weighting of 24%, returned a more modest 6.2%.
The funds that performed best were generally those with higher allocations to international shares, particularly where currency exposure was hedged. Diversification also played a role, given the wide dispersion of returns across asset classes during the year.
Not every asset class had a strong year, with Australian bonds, international bonds and cash returning 1.5%, 2.9% and 3.9% respectively, sitting among the weaker performers. Australian listed property was the only asset class to finish in negative territory, declining 1.8%.
In contrast, international listed real assets performed well. International listed infrastructure returned 17.2% and international listed property returned 14.3%.
For unlisted asset classes, final data is still being collected. However, we estimate that infrastructure returns will land in the 7% to 9% range, private equity in the 8% to 11% range, and unlisted property in the 5% to 7% range as it continues its recovery.
The conversation your clients are likely having with you
After four strong years, your clients may be concerned whether the good times can continue and whether a change to their retirement strategy is required. The data offers a grounding perspective.
Over the 34 financial years since compulsory super was introduced in 1992, growth funds have met their long-term return objective in 73% of rolling 10-year periods. Even across the past 20 years, which includes the GFC, COVID-19 and the inflation and rate rise cycle of 2022, the annualised return has been 6.9% p.a., comfortably ahead of the typical 6% target.
The message for clients is consistent: super is a long-term vehicle which requires a long-term strategy that stays the course, even when markets wobble and short-term performance is less positive.
The FY26 experience is another timely reminder for clients of the importance of maintaining a long-term perspective and not getting distracted by short-term market noise.
Disclaimer: ©Zenith CW Pty Ltd ABN 20 639 121 403 (Chant West), Authorised Representative of Zenith Investment Partners Pty Ltd ABN 27 103 132 672, AFSL 226872 under AFS Representative Number 1280401, 2023. This website is only intended for use by Australian residents and is subject to use in accordance with Chant West’s Terms of Use and should be read with Chant West’s Financial Services Guide. Products, reports, ratings (Information) are based on data which may be sourced from a third party and may not contain all the information required to evaluate the nominated product providers, you are responsible for obtaining further information as required. To the extent that any Information provided is advice, it is General Advice (s766B Corporations Act). Individuals should seek their own independent financial advice and consider the appropriateness of any financial product in light of their own circumstances and needs before making any investment decision. Chant West has not taken into account the objectives, financial situation or needs of any specific person who may access or use the Information provided including target markets of financial products, where applicable. It is not a specific recommendation to purchase, sell or hold any product(s) and is subject to change at any time without prior notice. Individuals should consider the appropriateness of any advice in light of their own objectives, financial situations or needs and should obtain a copy of and consider any relevant PDS or offer document before making any decision. Information is provided in good faith and is believed to be accurate, however, no representation, warranty or undertaking is provided in relation to the accuracy or completeness of the Information. Information provided is subject to copyright and may not be reproduced, modified or distributed without the consent of the copyright owner. Except for any liability which cannot be excluded, Chant West does not accept any liability whether direct or indirect, arising from use of the Information. Past performance is not an indication of future performance. Chant West ratings and research are prepared by Chant West and are not connected in any way to research and ratings prepared by any of our related entities.